. 2014 May 15;28(10):1068-84.
doi: 10.1101/gad.237206.113. Epub 2014 May 1.

An integrative analysis of colon cancer identifies an essential function for PRPF6 in tumor growth

Affiliations

An integrative analysis of colon cancer identifies an essential function for PRPF6 in tumor growth

Adam S Adler et al. Genes Dev. .

Abstract

The spliceosome machinery is composed of multimeric protein complexes that generate a diverse repertoire of mRNA through coordinated splicing of heteronuclear RNAs. While somatic mutations in spliceosome components have been discovered in several cancer types, the molecular bases and consequences of spliceosome aberrations in cancer are poorly understood. Here we report for the first time that PRPF6, a member of the tri-snRNP (small ribonucleoprotein) spliceosome complex, drives cancer proliferation by preferential splicing of genes associated with growth regulation. Inhibition of PRPF6 and other tri-snRNP complex proteins, but not other snRNP spliceosome complexes, selectively abrogated growth in cancer cells with high tri-snRNP levels. High-resolution transcriptome analyses revealed that reduced PRPF6 alters the constitutive and alternative splicing of a discrete number of genes, including an oncogenic isoform of the ZAK kinase. These findings implicate an essential role for PRPF6 in cancer via splicing of distinct growth-related gene products.

Keywords: PRPF6; RNAi; colon cancer; spliceosome; tri-snRNP.


Figures

Figure 1.
Figure 1.
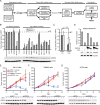
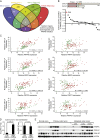
Integrative genomic analysis identifies PRPF6 as a driver of colon cancer growth in vitro and in vivo. (A) Schematic of RNAi viability screens and filtering methods. (B) Relative cell number (compared with siNTC; mean ± SD) is shown for two independent PRPF6 siRNAs 6 d after siRNA transfection. Cell lines are separated by high or low PRPF6 protein expression levels as determined by immunoblot analysis. (C) The average relative cell number for each siRNA in each group of cells lines. P-value is a Student’s t-test. (D) The bar graph shows cell number relative to nontreated control in SW620 cells with stable integration of a doxycycline (Dox)-inducible PRPF6 shRNA (SW620-shPRPF6Dox). Doxycycline-induced PRPF6 knockdown is indicated. Adenoviruses expressing either shRNA-resistant PRPF6 or a LacZ control were infected 2 d after doxycycline-induced PRPF6 knockdown at both a low and high multiplicity of infection. Cell number was measured 7 d after doxycycline induction. Immunoblot shows PRPF6 expression under the indicated conditions. (E–G) Xenograft tumor volume measurements over time (n = 10–15 mice per group) in KM-12 cells (E), SW620 cells (F), or HT55 cells (G). Mean ± SEM is shown. Immunoblot of PRPF6 protein levels in xenograft tumors were at day 7. (*) P-value < 0.05; (**) P-value < 0.001 for shPRPF6 + Dox as compared with shNTC + Dox groups.
Figure 2.
Figure 2.
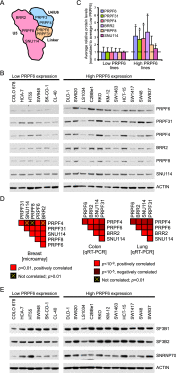
The tri-snRNP complex is coordinately overexpressed in colon cancer. (A) A schematic of the tri-snRNP complex with select components indicated. Adapted by permission from Macmillan Publishers Ltd.: Nature Structural Biology (Häcker et al. 2008), © 2008. (B) Immunoblot of several tri-snRNP complex components in low- and high-PRPF6-expressing cell lines. The PRPF6 blot from Figure 1B that was used to classify each cell line as having high or low PRPF6 expression is shown here for reference. (C) The level of each protein from the immunoblot shown in B was quantified relative to ACTIN, and the mean ± SD protein level for each group of cell lines is provided. The values were normalized to the average expression of the low-PRPF6-expressing cell lines. (*) P < 0.05, Student’s t-test. (D) Gene expression data from microarray (left) or qRT–PCR (right) for the indicated tri-snRNP complex genes were correlated to each other in the indicated tumor types using Pearson correlation across all tumor samples. Red boxes indicate that the two genes are positively correlated according to the P-value scales provided. Correlations that are not significant are crossed out in yellow (P > 0.01). P-values are one-tailed t-tests. (E) Immunoblot of spliceosome components in low- and high-PRPF6-expressing cell lines.
Figure 3.
Figure 3.
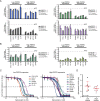
The tri-snRNP complex is required for proliferation in colon cancer. (A,B) Relative cell number (compared with siNTC; mean ± SD) is shown for two independent siRNAs 6 d after siRNA transfection in the indicated cell lines. P-values were calculated between each group of cell lines; Student’s t-test. (C) Spliceostatin A was added in twofold dilutions at the indicated final concentration to low- or high-PRPF6-expressing cell lines. The cell number (relative to no drug addition) 5 d after drug addition is provided. The data were fitted to a sigmoidal dose response curve, and the EC50 values were determined. (D) Mean ± SD EC50 values are shown for each group of cell lines from C. P-value is a Student’s t-test.
Figure 4.
Figure 4.
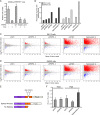
PRPF6 inhibition leads to intron retention in a small subset of genes. (A) The bar graph depicts cell number relative to nontreated control in SW620-shPRPF6Dox cells. Doxycycline-induced PRPF6 knockdown is indicated. Adenoviruses expressing wild-type or different mutant forms of shRNA-resistant PRPF6 are indicated. (B) The bar graph shows percentage of intron reads over total uniquely mapped reads based on RNA-seq data. Each bar represents the average percentage of two or three replicates. (C,D) The scatter plot shows the log2 fold change of normalized intron reads as a function of average intron read count for all genes in KM-12 cells (C) and SW620 cells (D). The normalized intron reads ratio is treatment/control (three replicates per group; control is no treatment). The mean intron reads is the average of all intron reads within the annotated intron regions for a given gene across all samples in the comparison (the three control samples and the three treatment samples). The genes with significant intron retention are shown in red, while genes with significant decreased intron reads are shown in blue. (E) Schematic representation of splicing dual-reporter assay that mimics endogenous splicing by insertion of recombinant gene fragments flanked by an intronic region with stop codons. (F) The bar graph depicts splicing activity as measured by the Renilla (R-Luc) to firefly (F-Luc) luciferase ratio 3 d after transfection of the indicated siRNAs along with two splicing reporters, TN23 and TN24. Spliceostatin A was incubated with siNTC-treated cells for 8 h and was used as a control. Representative results are shown for one of three independent experiments (mean ± SD).
Figure 5.
Figure 5.
PRPF6 regulates splicing of the ZAK protein kinase. (A) Gene isoform usage changes are analyzed after PRPF6 loss. A four-way Venn diagram illustrates the number of genes that have significantly reduced isoform expression upon PRPF6 depletion. Criteria for gene selection are reduced isoform usage in exon microarray (adjusted P-value <0.05) and RNA-seq data (adjusted P-value ≤0.005 and mean read counts >50) using two independent siRNAs targeting PRPF6 in at least one of two cell lines tested (KM-12 and SW620). (B) The distribution plot ranks the degree of correlation between PRPF6 expression and the 25 gene isoforms down-regulated after PRPF6 loss (ΔSpearman = [Spearmandownregulated isoform − Spearmanunchanged isoform]). A schematic of the domains of the different isoforms of the top-scoring gene (ZAK) is shown. (LZ) Leucine zipper domain; (SAM) sterile α motif. (C) The scatter plot shows expression correlation of tri-snRNP genes PRPF6, BRR2, PRPF3, and PRPF31 to long (ZAK-LF; NM_016653) and short (ZAK-SF; NM_133646) transcript variants of the ZAK gene. Each dot represents one sample. Green and red circles denote normal colon and colon cancer, respectively. Spearman’s rank correlation coefficients (R-values) and associated P-values are shown in each plot. (D) The bar graph shows the correlation between PRPF6 protein (IHC) and ZAK mRNA isoform expression (ISH) in human colon cancer samples. PRPF6-high and PRPF6-low cutoffs are defined as tumors in which ≥30% or <30% of the cancer cells express PRPF6 protein, respectively. ZAK mRNA expression is scored on a qualitative scale. (0) No expression; (1) weak; (2) moderate; (3) strong staining. Sample size for each cohort is indicated below the bar graph. Mean ± SD is shown, and P-values are indicated (Student’s t-test). (E) Immunoblot showing PRPF6 and ZAK isoform expression in the indicated human colon specimens.
Figure 6.
Figure 6.
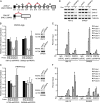
PRPF6 regulates ZAK-LF alternative splicing and associates with unspliced ZAK mRNA. (A) The schematic cartoon shows the TaqMan probe locations that were used to detect ZAK spliced (A–C) and unspliced (I–IV) mRNA species ([E] exon number). (B,C) qRT–PCR analysis of spliced ZAK isoforms and unspliced ZAK pre-mRNA after PRPF6 knockdown. RNA was isolated from the indicated cell lines 4 d after exposure to doxycycline to induce PRPF6 knockdown. Changes in ZAK mRNA species were quantitated by TaqMan qRT–PCR from doxycycline-treated or untreated cells and normalized to an intronless control gene, H2A. Primers were used as indicated in A. The bar graph shows mean ± SD. (*) P < 0.05; (**) P < 0.001 compared with ZAK pre-mRNA expression (probe I), Student’s t-test. (D) Immunoblot showing ZAK-LF and ZAK-SF expression changes 4 or 5 d after doxycycline-induced PRPF6 knockdown in SW620 and KM-12 cell lines. (E) RNA-IP analysis of PRPF6 binding to ZAK mRNA. RNA samples were purified from whole cellular lysates (input) or PRPF6 and IgG control immunoprecipitates in the indicated cell lines. ZAK mRNA was detected using TaqMan qRT–PCR with the indicated primers. The bar graphs depict the relative binding compared with input levels. Error bars are SDs from triplicate measurements. (F) RNA-IP analysis of BRR2 and PRPF8 binding to ZAK mRNA. Experiments were performed as in E.
Figure 7.
Figure 7.
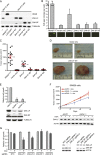
The PRPF6-regulated ZAK protein isoform is oncogenic. (A) Immunoblot showing expression levels of wild-type (WT) and kinase-dead (KD) ZAK variants in NIH-3T3 immortalized murine fibroblasts that were transduced with the indicated constructs. Expression of ZAK in untransfected KM-12 colon cancer cells is shown for reference. (B) The bar graph shows anchorage-independent growth in NIH-3T3 cells infected with the indicated lentiviral expression vectors. Representative photomicrographs show discrete colony formation in ZAK-LF (WT)- and HRAS-expressing NIH-3T3 cells (transduced cells express GFP). Experiments were performed in triplicate (mean ± SD is shown). (*) P < 0.01 compared with vector only; (**) P < 0.005 compared with vector only, Student’s t-test. (C) The graph shows the tumor volume of transduced NIH-3T3 cells grown as subcutaneous tumors in immunodeficient mice. Tumor size was measured 14 d after xenografting. Each point represents a single tumor measurement (n = 15 animals per group; mean ± SD is shown). (**) P < 0.0001 compared with vector only. (D) Representative photographic images of tumors are shown at day 14 after injection of NIH-3T3 cells transduced with either ZAK-LF wild-type or negative control vector. (E) The bar graph shows relative cell number (compared with shNTC; mean ± SD) for two independent shRNAs 7 d after shRNA infection in the KM-12 cell line. (*) P < 0.001 compared with shNTC, Student’s t-test. The immunoblot shows expression of ZAK-LF and ZAK-SF 4 d after shRNA infection. (F) Xenograft tumor volume measurements over time (n = 10–15 mice per group) in SW620 cells. Mean ± SEM is shown. (*) P < 0.05 compared with the shNTC + Dox control group; Student’s t-test. Immunoblot of ZAK-LF protein levels in xenografted tumors 7 d after knockdown induction is shown. (G) The bar graph shows relative cell number (compared with NTC sgRNA, no doxycycline; mean ± SD) for KM-12 cells in the absence or presence of doxycycline-inducible CAS9 expression. (*) P < 0.01 compared with the respective ZAK-LF sgRNA, no doxycycline, Student’s t-test. Immunoblot shows expression of ZAK-LF and ZAK-SF 7 d after induction of CAS9 and sgRNA expression.

Comment in

Similar articles

Cited by

References

    1. Adler AS, McCleland ML, Truong T, Lau S, Modrusan Z, Soukup TM, Roose-Girma M, Blackwood EM, Firestein R 2012. CDK8 maintains tumor dedifferentiation and embryonic stem cell pluripotency. Cancer Res 72: 2129–2139 - PubMed
    1. Anders S, Huber W 2010. Differential expression analysis for sequence count data. Genome Biol 11: R106. - PMC - PubMed
    1. Anders S, Reyes A, Huber W 2012. Detecting differential usage of exons from RNA-seq data. Genome Res 22: 2008–2017 - PMC - PubMed
    1. Baker SJ, Fearon ER, Nigro JM, Hamilton SR, Preisinger AC, Jessup JM, vanTuinen P, Ledbetter DH, Barker DF, Nakamura Y, et al. 1989. Chromosome 17 deletions and p53 gene mutations in colorectal carcinomas. Science 244: 217–221 - PubMed
    1. Bardelli A, Corso S, Bertotti A, Hobor S, Valtorta E, Siravegna G, Sartore-Bianchi A, Scala E, Cassingena A, Zecchin D, et al. 2013. Amplification of the MET receptor drives resistance to anti-EGFR therapies in colorectal cancer. Cancer Discov 3: 658–673 - PMC - PubMed