. 2014 Jun;42(10):6552-66.
doi: 10.1093/nar/gku245. Epub 2014 Apr 29.

Auxiliary tRNAs: large-scale analysis of tRNA genes reveals patterns of tRNA repertoire dynamics

Affiliations

Auxiliary tRNAs: large-scale analysis of tRNA genes reveals patterns of tRNA repertoire dynamics

Naama Wald et al. Nucleic Acids Res. 2014 Jun.

Abstract

Decoding of all codons can be achieved by a subset of tRNAs. In bacteria, certain tRNA species are mandatory, while others are auxiliary and are variably used. It is currently unknown how this variability has evolved and whether it provides an adaptive advantage. Here we shed light on the subset of auxiliary tRNAs, using genomic data from 319 bacteria. By reconstructing the evolution of tRNAs we show that the auxiliary tRNAs are highly dynamic, being frequently gained and lost along the phylogenetic tree, with a clear dominance of loss events for most auxiliary tRNA species. We reveal distinct co-gain and co-loss patterns for subsets of the auxiliary tRNAs, suggesting that they are subjected to the same selection forces. Controlling for phylogenetic dependencies, we find that the usage of these tRNA species is positively correlated with GC content and may derive directly from nucleotide bias or from preference of Watson-Crick codon-anticodon interactions. Our results highlight the highly dynamic nature of these tRNAs and their complicated balance with codon usage.


Figures

Figure 1.
Figure 1.
The tRNA repertoire is highly variable. (A) The number of organisms (out of 319) that have at least one copy of a tRNA species. The numbers above the bars represent the number of codons in the relevant codon quartet that code for the amino acid decoded by the tRNA. (B) A schematic representation of known codon–anticodon interactions. Black solid arrows represent commonly occurring interactions. Gray arrows represent possible interactions when Adenosine is modified to Inosine in the first anticodon position. Black dashed arrows represent modifications-dependent interactions when the first anticodon position contains Uridine. The thickness of the dashed arrows represents interaction efficiency.
Figure 2.
Figure 2.
Auxiliary tRNA presence/absence profile is mostly associated with GC content. Regression analysis of tRNA presence/absence profile with genome size (top), GC content (middle) and ENC’diff (bottom). RNA species that exhibited little presence/absence variability (when three or less organisms had a different presence/absence status than the majority of organisms) are not presented. In parentheses are the number of codons in the relevant codon quartet that code for the amino acid decoded by the tRNA and the number of organisms in which the tRNA species was found (out of 319). R2 is the amount of variation explained by the regression model (note the different R2 range). Asterisks denote statistically independent genomic traits that when added to regression between the dependent variable (tRNA presence/absence) and each of the additional genomic traits, statistically significantly improved the fit of the data to the calculated regression model.
Figure 3.
Figure 3.
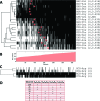
GC content effect on auxiliary tRNA species is variable. (A) Clustering of the presence/absence (black/white, respectively) profiles of auxiliary tRNA species in 319 bacteria. tRNA species are clustered based on Hamming distance while bacteria are arranged by their GC content presented in (B). The GC content where a tRNA species tends to appear/disappear (usage shift) was defined as the mean between the GC content of the 75 percentile of organisms missing the tRNA and the 25 percentile of organisms that possess the tRNA. Asterisks mark the usage shift location based on B. In parentheses are the number of codons in the relevant codon quartet that code for the amino acid decoded by the tRNA, and the usage shift value, separated by a comma. (C) The same as A for the four Arg tRNA species of the type N34C35G36. (D) Distribution of Arg tRNA species combinations among the genomes.
Figure 4.
Figure 4.
Auxiliary tRNA evolution is highly dynamic and dominated by gene loss. Sum of gain (blue) and loss (red) branch probabilities over the phylogenetic tree calculated by GLOOME. tRNA species are listed alphabetically by their anticodon sequence. Light gray dots mark auxiliary tRNA species. Dark grey dots mark Arg auxiliary tRNA species.
Figure 5.
Figure 5.
tRNA sequence similarity may reveal the origin of newly acquired tRNA genes. (A) A schematic example of tRNA-X ancestral reconstruction. The shade of the blue dots indicates the probability of tRNA-X presence (zero probability is not presented, low probabilities appear white). Red dots mark nodes of MRGEs, where tRNA-X gain is predicted with probability of at least 0.8, and no additional gain event of tRNA-X is found below it in the tree. Yellow dots mark all the currently extant organisms descending from an ancestor where an MRGE occurred. The grey lines connect two organisms demonstrating high tRNA gene sequence similarity according to BLAST. (B–F) Mechanisms most likely to explain tRNA gene similarity: (B) Vertical gene transfer can explain similarity of two tRNA-X genes (yellow curly lines) descending from the same MRGE. (C) Horizontal gene transfer can explain similarity of two tRNA-X genes descending from different MRGEs. (D) Horizontal gene transfer of tRNA-Y (magenta curly line) followed by mutations transforming tRNA-Y to tRNA-X can explain similarity of tRNA-X and tRNA-Y genes from distantly related organisms. (E) Similar to D but in closely related organisms. Due to vertical gene transfer, closely related organisms have a copy of tRNA-Y. A mutation that transforms tRNA-Y to tRNA-X in one organism creates very similar orthologs of different tRNA species. (F) Gene duplication followed by anticodon mutation creates very similar paralogous genes that encode different tRNA species.
Figure 6.
Figure 6.
tRNA genes are acquired by multiple pathways. (A–C) Similarities between tRNA genes can explain how tRNA genes are acquired. Tree visualization is as described for Figure 5A. Arrows connect organisms that have similar tRNA genes. The arrows are black if the similarity is explained by vertical inheritance and green if by non-vertical inheritance. Clades not involved in gene transfer are collapsed (black triangles). (A) C34G35U36-Thr tRNA genes in the Enterobacteriaceae family show similarity within the family and are similar to C34G35U36-Thr in the Neisseriaceae family, suggesting horizontal gene transfer of C34G35U36-Thr from the Neisseriaceae family to the Enterobacteriaceae family, followed by vertical gene spread. β, γ, E and N mark the clades of the Betaproteobacteria and Gammaproteobacteria classes and the Enterobacteriaceae and Neisseriaceae families, respectively. (B) The A34C35G36-Arg tRNA gene in Carboxydothermus hydrogenoformans (taxonomy ID: 246194) is the most similar gene to the new U34C35G36-Arg tRNA in Natranaerobius thermophilus (taxonomy ID: 457570), suggesting horizontal gene transfer followed by an A to T mutation in the first anticodon position. (C) G34C35C36-Gly tRNA gene in Capnocytophaga ochracea (taxonomy ID: 521097) is the most similar gene to the new C34C35C36-Gly tRNA of the same organism, suggesting that the G34C35C36-Gly tRNA gene underwent duplication followed by a G to C mutation in the first anticodon position. (D) Alignment of the two tRNA genes discussed in C. The duplication/mutation theory is supported by similarities in the sequences flanking the genes. The anticodons of both genes are marked in red.

Similar articles

Cited by

References

    1. Agris P.F. Decoding the genome: a modified view. Nucleic Acids Res. 2004;32:223–238. - PMC - PubMed
    1. Marck C., Grosjean H. tRNomics: analysis of tRNA genes from 50 genomes of Eukarya, Archaea, and Bacteria reveals anticodon-sparing strategies and domain-specific features. RNA. 2002;8:1189–1232. - PMC - PubMed
    1. Ikemura T. Correlation between the abundance of Escherichia coli transfer RNAs and the occurrence of the respective codons in its protein genes: a proposal for a synonymous codon choice that is optimal for the E. coli translational system. J. Mol. Biol. 1981;151:389–409. - PubMed
    1. dos Reis M., Savva R., Wernisch L. Solving the riddle of codon usage preferences: a test for translational selection. Nucleic Acids Res. 2004;32:5036–5044. - PMC - PubMed
    1. Tuller T., Girshovich Y., Sella Y., Kreimer A., Freilich S., Kupiec M., Gophna U., Ruppin E. Association between translation efficiency and horizontal gene transfer within microbial communities. Nucleic Acids Res. 2011;39:4743–4755. - PMC - PubMed

Publication types