. 2014 May 5;211(5):781-90.
doi: 10.1084/jem.20131916. Epub 2014 Apr 28.

PD-L1 is a novel direct target of HIF-1α, and its blockade under hypoxia enhanced MDSC-mediated T cell activation

Affiliations

PD-L1 is a novel direct target of HIF-1α, and its blockade under hypoxia enhanced MDSC-mediated T cell activation

Muhammad Zaeem Noman et al. J Exp Med. .

Abstract

Tumor-infiltrating myeloid cells such as myeloid-derived suppressor cells (MDSCs) and tumor-associated macrophages (TAMs) form an important component of the hypoxic tumor microenvironment. Here, we investigated the influence of hypoxia on immune checkpoint receptors (programmed death [PD]-1 and CTLA-4) and their respective ligands (PD-1 ligand 1 [PD-L1], PD-L2, CD80, and CD86) on MDSCs. We demonstrate that MDSCs at the tumor site show a differential expression of PD-L1 as compared with MDSCs from peripheral lymphoid organ (spleen). Hypoxia caused a rapid, dramatic, and selective up-regulation of PD-L1 on splenic MDSCs in tumor-bearing mice. This was not limited to MDSCs, as hypoxia also significantly increased the expression of PD-L1 on macrophages, dendritic cells, and tumor cells. Furthermore, PD-L1 up-regulation under hypoxia was dependent on hypoxia-inducible factor-1α (HIF-1α) but not HIF-2α. Chromatin immunoprecipitation and luciferase reporter assay revealed direct binding of HIF-1α to a transcriptionally active hypoxia-response element (HRE) in the PD-L1 proximal promoter. Blockade of PD-L1 under hypoxia enhanced MDSC-mediated T cell activation and was accompanied by the down-regulation of MDSCs IL-6 and IL-10. Finally, neutralizing antibodies against IL-10 under hypoxia significantly abrogated the suppressive activity of MDSCs. Simultaneous blockade of PD-L1 along with inhibition of HIF-1α may thus represent a novel approach for cancer immunotherapy.


Figures
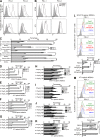
Figure 1.
Figure 1.
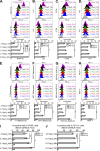
Tumor-infiltrating MDSCs differentially express PD-L1 as compared with splenic MDSCs, and hypoxia selectively up-regulates PD-L1 on splenic MDSCs in tumor-bearing mice. Surface expression level of PD-L1 and PD-L2 on Gr1+ CD11b+ cells (MDSCs) from (B16-F10 and LLC; A; CT26 and 4T1; B) in spleens (black dotted line histogram) and tumor (black line histogram) as compared with isotype control (gray-shaded histogram) was analyzed by flow cytometry. (C) Statistically significant differences (indicated by asterisks) between tumor-infiltrating MDSCs and splenic MDSCs are shown (*, P < 0.05; **, P < 0.005; ***, P < 0.0005). Each tumor model included n = 5 mice. Three experiments with the same results were performed. Error bars indicate SD. (D–G) MDSCs were isolated from spleens of B16 (D), LLC (E), CT26 (F), and 4T1 (G) tumor-bearing mice and cultured at indicated times under normoxic and hypoxic (0.1% pO2) conditions. Shown is the percentage of PD-L1+ or PD-L2+ cells among Gr1+ CD11b+ cells obtained from different tumor models. (H–K) Shown is the percentage of CD80+, CD86+, PD-1+, and CTLA-4+ cells among Gr1+ CD11b+ cells obtained from B16-F10 (H), LLC (I), CT26 (J), and 4T1 (K) tumor-bearing mice. Statistically significant differences (indicated by asterisks) between splenic MDSCs cultured under normoxia or hypoxia are shown (*, P < 0.05; **, P < 0.005; ***, P < 0.0005). Each tumor model included n = 3 mice. Three separate experiments with the same results were performed. Error bars indicate SD. (L and M) B16-F10 tumor-bearing C57BL/6 mice or 4T1 tumor-bearing BALB/c mice were injected i.p. with either PBS1X, 30 or 60 mg/kg of cobalt chloride (CoCl2). Surface expression level of PD-L1 and PD-L2 on Gr1+ CD11b+ cells (MDSCs) from B16-F10 (L) and 4T1 (M) total splenocytes was analyzed by flow cytometry. Each tumor model included n = 3 mice. Statistically significant differences (indicated by asterisks) between mice treated with PBS1X or CoCl2 are shown (*, P < 0.05; **, P < 0.005). Data represent two independent experiments with SD.
Figure 2.
Figure 2.
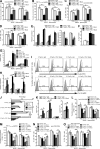
Hypoxia up-regulates PD-L1 on mouse and human tumor cell lines and on macrophages and DCs from naive C57BL/6 mice. (A–H) Mouse and human tumor cell lines were cultured under normoxia and hypoxia (0.1% pO2) at indicated times. Recombinant mouse or human IFN-γ–treated (10 ng/ml) cells were used as positive control for PD-L1 induction under normoxia for 24 h. Shown is the surface expression of PD-L1 and PD-L2 on B16-F10 (A), LLC (B), CT26 (C), 4T1 (D), T1 (E), M4T (F), IGR-Heu (G), and MCF-7 (H) tumor cells. Statistically significant differences (indicated by asterisks) between tumor cells cultured under normoxia or hypoxia are shown (*, P < 0.05; **, P < 0.005; ***, P < 0.0005). Three separate experiments with the same results were performed. Error bars indicate SD. (I and J) C57BL/6 naive mice spleens were used for preparing single-cell suspensions by mechanical dissociation, followed by removal of red blood cells with ammonium chloride lysis buffer (ACK). Macrophages and DCs were further isolated by cell sorting on FACS MoFlo or FACSAria (BD) after incubating with F4/80+ PE or CD11c+ APC-conjugated antibodies, respectively. The sorted F4/80+ PE (I) and CD11c+ APC (J) cells were incubated under normoxia or hypoxia (0.1% pO2) for 24, 48, and 72 h, and PD-L1 and PD-L2 expression was evaluated by flow cytometry. Statistically significant differences (indicated by asterisks) between macrophages and DCs incubated under normoxia or hypoxia are shown (*, P < 0.05; **, P < 0.005). The experiment was performed with n = 3 mice and repeated twice with the same results. Error bars indicate SD.
Figure 3.
Figure 3.
HIF-1α binds directly to the HRE in the PD-L1 proximal promoter and up-regulates its expression under hypoxia. (A–F) Surface expression levels of PD-L1 and PD-L2 (A and B) on MSC-1 cells cultured under normoxia and hypoxia (0.1% pO2) at indicated times as compared with isotype control (gray-shaded histogram). IFN-γ was used as a positive control for PD-L1 up-regulation. Statistically significant differences (indicated by asterisks) between MSC-1 cells cultured under normoxia or hypoxia are shown (**, P < 0.005; ***, P < 0.0005). Three separate experiments with the same results were performed. Error bars indicate SD. (C) Western blot was performed to show HIF-1α, HIF-2α, and PD-L1 protein levels. β-Actin was used as a control. Three separate experiments with the same results were performed. (D–F) SYBR Green RT-qPCR was used to monitor Ldha, Car-9, Pdl1, Pdl2, Pd1, and Ctla-4 expressions levels at indicated conditions in MSC-1 (D), B16-F10 spleen Gr1+ (E), and 4T1 spleen Gr1+ (F) cells. Expression level of 18S was used as endogenous control. Statistically significant differences (indicated by asterisks) between cells (MSC-1 or spleen Gr1+) cultured under normoxia or hypoxia are shown (*, P < 0.05; **, P < 0.005; ***, P < 0.0005). Three separate experiments (in triplicates) with the same results were performed. Error bars indicate SD. (G–K) MSC-1 cells were transfected with different siRNA targeting HIF-1α, HIF-2α, or scrambled control (CT) and cultured under normoxia or hypoxia for 48 h. Expression levels of Ldha, Car-9, HIF-1α, HIF-2α, and Vegfa (G) and Cd80, Cd86, Pdl1, Pdl2, Pd1, and Ctla-4 (H) were evaluated by SYBR Green RT-qPCR. (I) Western blot was performed to show HIF-1α, HIF-2α, and PD-L1 protein levels. β-Actin was used as a control. (J) Surface expression levels of PD-L1 and PD-L2 were determined by flow cytometry. (K) Surface expression levels of CD80, CD86, PD-1, and CTLA-4 were determined by flow cytometry. Statistically significant differences (indicated by asterisks) between MSC-1 cells transfected with either siRNA-CT and siRNA-HIF-1α are shown (*, P < 0.05; **, P < 0.005; ***, P < 0.0005). The experiment was repeated three times with the same results. Error bars indicate SD. (L) MSC-1 cells were cultured at normoxia or hypoxia (0.1% pO2) and ChIP was performed using anti-HIF-1α antibody followed by SYBR Green RT-qPCR using Vegfa, Ldha, Slc2a1, and Pdl1 HRE sites (HRE-1, HRE-2/3, and HRE-4) and RPL13A primers. For each gene, the RT-qPCR signals were normalized to the normoxic condition. Statistically significant differences (indicated by asterisks) between normoxic and hypoxic conditions are shown (*, P < 0.05; **, P < 0.005). Two separate experiments (in triplicates) with the same results were performed. Error bars indicate SD. (M) Different HREs in mouse PD-L1 promoter (PD-L1 mRNA; NCBI reference sequence NM_021893.3) are shown. The numbering scheme is from the refseq RNA start. (N) MSC-1 cells were co-transfected with pGL4-hRluc/SV40 vector and pGL3 empty vector (pGL3 EV), pGL3 HRE-4, or pGL3 HRE-4 MUT vectors and grown under normoxia or hypoxia. After 48 h, firefly and renilla luciferase activities were measured using the Dual-Luciferase Reporter assay (Promega) and the ratio of firefly/Renilla luciferase was determined. Statistically significant differences (indicated by asterisks) between normoxic and hypoxic conditions are shown (**, P < 0.005; ***, P < 0.0005). The experiment was performed in triplicates and repeated three times with the same results. Error bars indicate SD.
Figure 4.
Figure 4.
Blockade of PD-L1 under hypoxia down-regulates MDSC IL-6 and IL-10 and enhances T cell proliferation and function. MDSCs isolated from spleens of B16-F10 tumor-bearing mice were pretreated for 30 min on ice with 5 µg/ml control antibody (IgG) or antibody against PD-L1 (PDL1 Block) and co-cultured with splenocytes under normoxia and hypoxia for 72 h. (A and B) Effect of MDSC on proliferation of splenocytes stimulated with (A) anti-CD3/CD28 coated beads or (B) TRP-2(180–88) peptide under the indicated conditions. Cell proliferation was measured in triplicates by [3H]thymidine incorporation and expressed as counts per minute (CPM). (C and D) MDSCs were cultured with splenocytes from B16-F10 mice stimulated with anti-CD3/CD28. Intracellular IFN-γ production was evaluated by flow cytometry by gating on (C) CD3+CD8+ IFN-γ+ and (D) CD3+CD4+ IFN-γ+ populations. Statistically significant differences (indicated by asterisks) are shown (**, P < 0.005; ***, P < 0.0005). Three separate experiments (in triplicates) with the same results were performed. Error bars indicate SD. (E) SYBR-GREEN RT-qPCR was performed to evaluate the mRNA expression levels of Ldha, Car-9, Arg-1, Nos2, Ncf-1, and Cybb-1. (F) Arginase enzymatic activity measured in MDSCs under indicated conditions. (G) After 72 h of MDSC co-culture with splenocytes, supernatants were collected and assayed for nitrites. Data represents three independent experiments with SD. (H) SYBR Green RT-qPCR was performed for expression levels of IL6, IL10, Il12p70, and Tgfb1 under the indicated conditions. IL-6, IL-10, IL-12p70, and TGF-β1 cytokine production and secretion was detected by (I and J) intracellular FACS staining (isotype control is gray-shaded histogram) and (K) ELISA, respectively. Statistically significant differences (indicated by asterisks) are shown (*, P < 0.05; **, P < 0.005; ***, P < 0.0005). The experiment was performed in triplicates and repeated three times with the same results. Error bars indicate SD. (L–O) MDSCs isolated from spleens of B16-F10 tumor-bearing mice were co-cultured with splenocytes under normoxia and hypoxia for 72 h in the presence of either 10 µg/ml control antibody (IgG), anti–mouse IL-6 Functional Grade Purified neutralizing antibody (IL-6 Block) or anti–mouse IL-10 Functional Grade Purified neutralizing antibody (IL-10 Block). Effect of MDSCs on proliferation of splenocytes stimulated with (L) anti-CD3/CD28–coated beads or (M) TRP-2(180–88) peptide under the indicated conditions. Cell proliferation was measured as indicated above. MDSCs were cultured with splenocytes from B16-F10 mice stimulated with anti-CD3/CD28. Intracellular IFN-γ production was evaluated by flow cytometry by gating on (N) CD3+CD8+ IFN-γ+ and (O) CD3+CD4+ IFN-γ+ populations. Statistically significant differences (indicated by asterisks) are shown (*, P < 0.05; **, P < 0.005). Two separate experiments (in triplicates) with the same results were performed. Error bars indicate SD.

Similar articles

Cited by

References

    1. Apolloni E., Bronte V., Mazzoni A., Serafini P., Cabrelle A., Segal D.M., Young H.A., Zanovello P. 2000. Immortalized myeloid suppressor cells trigger apoptosis in antigen-activated T lymphocytes. J. Immunol. 165:6723–6730 - PubMed
    1. Brahmer J.R., Tykodi S.S., Chow L.Q., Hwu W.J., Topalian S.L., Hwu P., Drake C.G., Camacho L.H., Kauh J., Odunsi K., et al. 2012. Safety and activity of anti-PD-L1 antibody in patients with advanced cancer. N. Engl. J. Med. 366:2455–2465 10.1056/NEJMoa1200694 - DOI - PMC - PubMed
    1. Clambey E.T., McNamee E.N., Westrich J.A., Glover L.E., Campbell E.L., Jedlicka P., de Zoeten E.F., Cambier J.C., Stenmark K.R., Colgan S.P., Eltzschig H.K. 2012. Hypoxia-inducible factor-1 alpha-dependent induction of FoxP3 drives regulatory T-cell abundance and function during inflammatory hypoxia of the mucosa. Proc. Natl. Acad. Sci. USA. 109:E2784–E2793 10.1073/pnas.1202366109 - DOI - PMC - PubMed
    1. Corzo C.A., Condamine T., Lu L., Cotter M.J., Youn J.I., Cheng P., Cho H.I., Celis E., Quiceno D.G., Padhya T., et al. 2010. HIF-1α regulates function and differentiation of myeloid-derived suppressor cells in the tumor microenvironment. J. Exp. Med. 207:2439–2453 10.1084/jem.20100587 - DOI - PMC - PubMed
    1. Curiel T.J., Wei S., Dong H., Alvarez X., Cheng P., Mottram P., Krzysiek R., Knutson K.L., Daniel B., Zimmermann M.C., et al. 2003. Blockade of B7-H1 improves myeloid dendritic cell-mediated antitumor immunity. Nat. Med. 9:562–567 10.1038/nm863 - DOI - PubMed

Publication types

MeSH terms