. 2014 Apr 28:14:295.
doi: 10.1186/1471-2407-14-295.

Ganglioside GD2 in reception and transduction of cell death signal in tumor cells

Affiliations

Ganglioside GD2 in reception and transduction of cell death signal in tumor cells

Igor I Doronin et al. BMC Cancer. .

Abstract

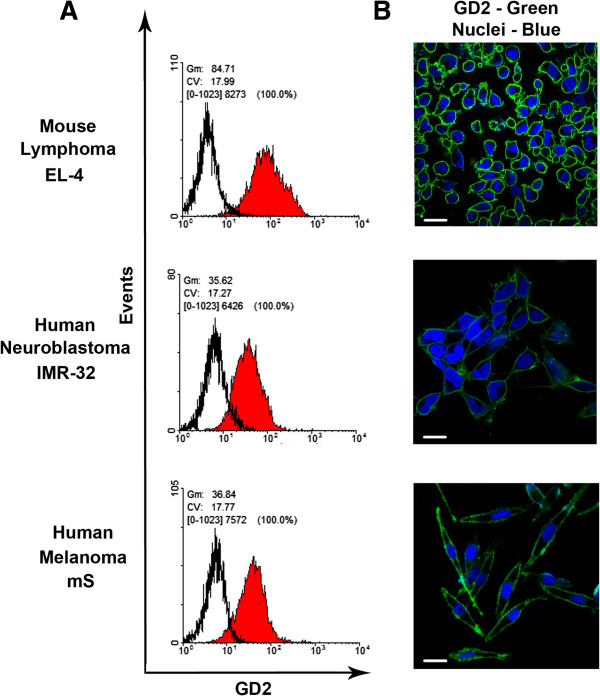
Background: Ganglioside GD2 is expressed on plasma membranes of various types of malignant cells. One of the most promising approaches for cancer immunotherapy is the treatment with monoclonal antibodies recognizing tumor-associated markers such as ganglioside GD2. It is considered that major mechanisms of anticancer activity of anti-GD2 antibodies are complement-dependent cytotoxicity and/or antibody-mediated cellular cytotoxicity. At the same time, several studies suggested that anti-GD2 antibodies are capable of direct induction of cell death of number of tumor cell lines, but it has not been investigated in details. In this study we investigated the functional role of ganglioside GD2 in the induction of cell death of multiple tumor cell lines by using GD2-specific monoclonal antibodies.

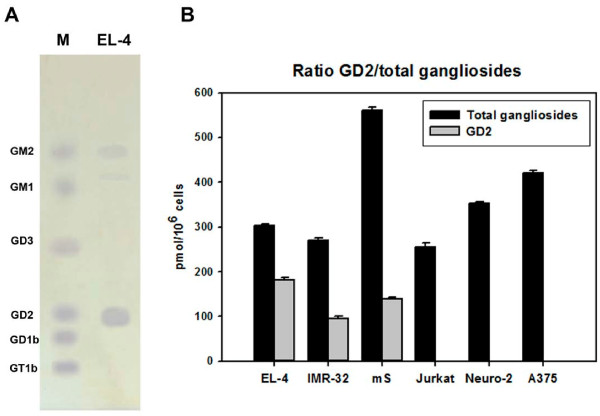
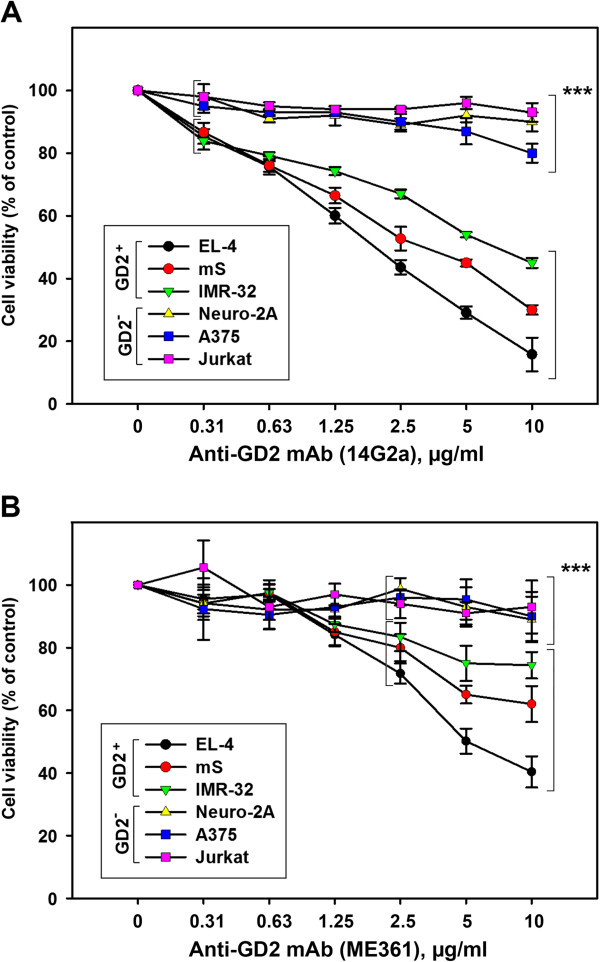
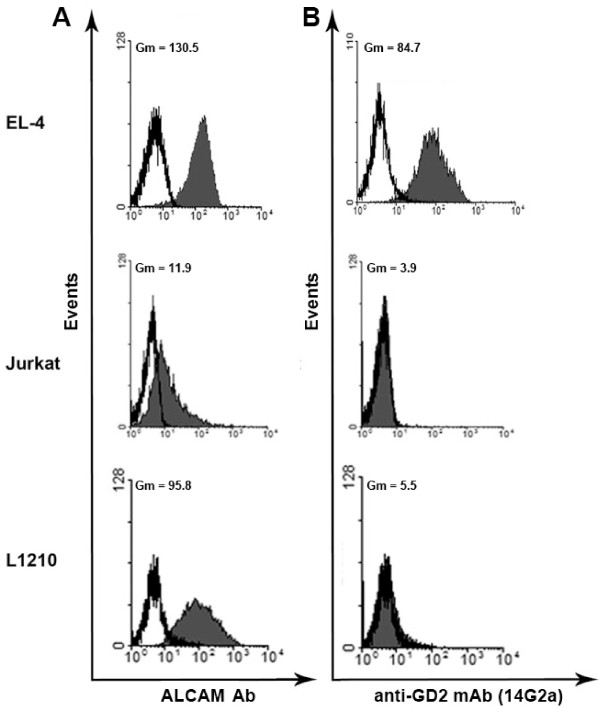
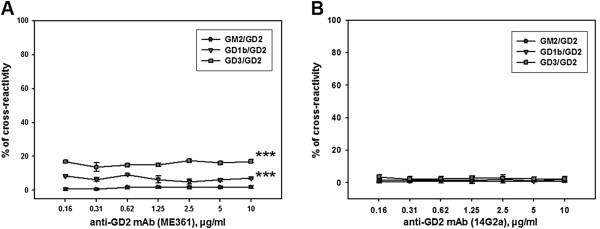
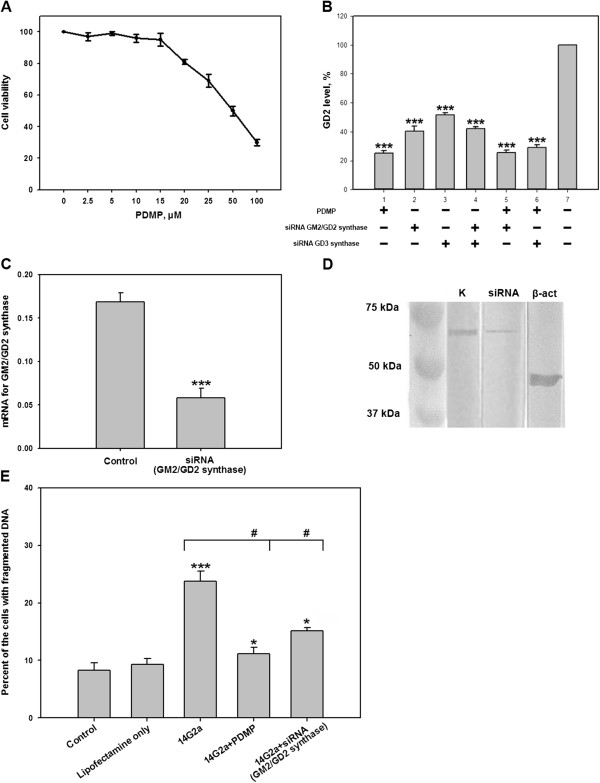
Methods: Expression of GD2 on different tumor cell lines was analyzed by flow cytometry using anti-GD2 antibodies. By using HPTLC followed by densitometric analysis we measured the amount of ganglioside GD2 in total ganglioside fractions isolated from tumor cell lines. An MTT assay was performed to assess viability of GD2-positive and -negative tumor cell lines treated with anti-GD2 mAbs. Cross-reactivity of anti-GD2 mAbs with other gangliosides or other surface molecules was investigated by ELISA and flow cytometry. Inhibition of GD2 expression was achieved by using of inhibitor for ganglioside synthesis PDMP and/or siRNA for GM2/GD2 and GD3 synthases.

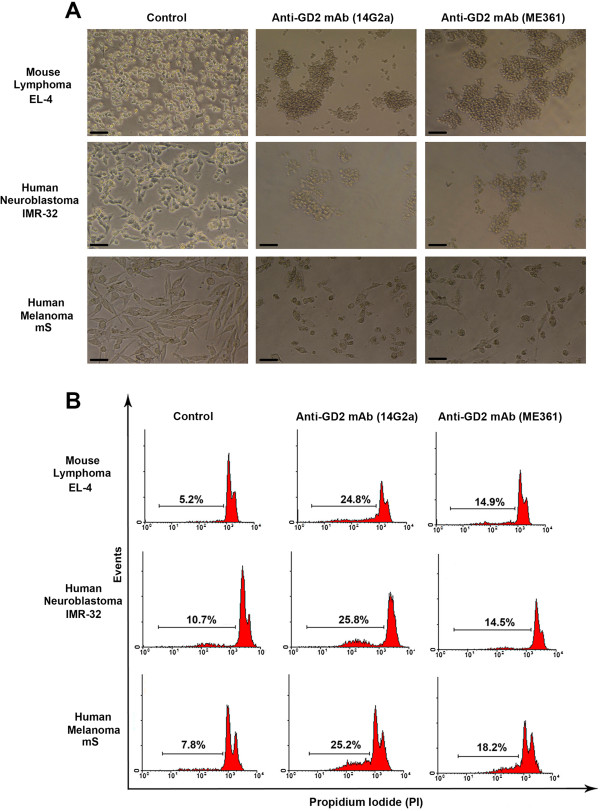
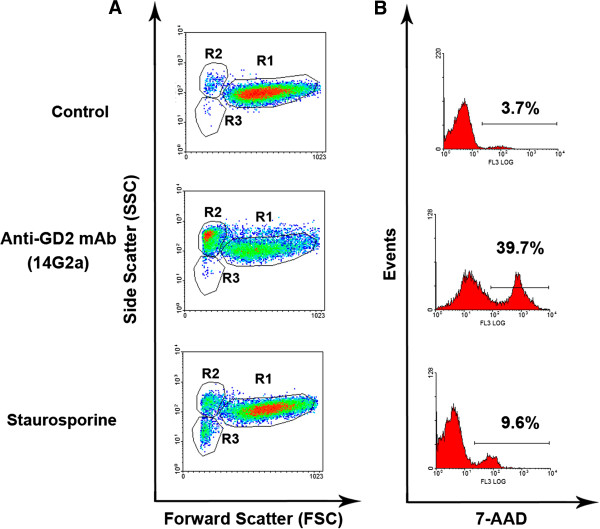
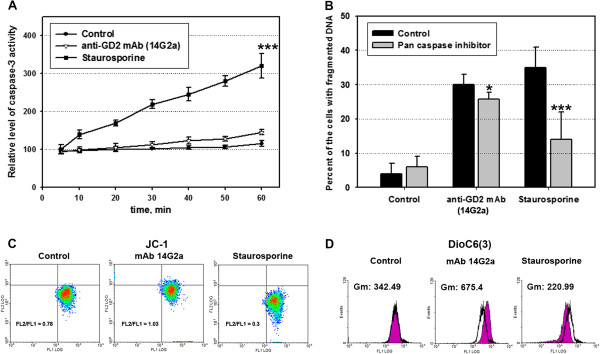
Results: Anti-GD2 mAbs effectively induced non-classical cell death that combined features of both apoptosis and necrosis in GD2-positive tumor cells and did not affect GD2-negative tumors. Anti-GD2 mAbs directly induced cell death, which included alteration of mitochondrial membrane potential, induction of apoptotic volume decrease and cell membrane permeability. This cytotoxic effect was mediated exclusively by specific binding of anti-GD2 antibodies with ganglioside GD2 but not with other molecules. Moreover, the level of GD2 expression correlated with susceptibility of tumor cell lines to cytotoxic effect of anti-GD2 antibodies.

Conclusions: Results of this study demonstrate that anti-GD2 antibodies not only passively bind to the surface of tumor cells but also directly induce rapid cell death after the incubation with GD2-positive tumor cells. These results suggest a new role of GD2 as a receptor that actively transduces death signal in malignant cells.


Figures

Figure 1
Figure 1
Expression of GD2 on the cell surface of EL-4, IMR-32, and mS tumor cell lines. Flow cytometry analysis of the cells stained with anti-GD2 antibodies conjugated with AlexaFluor488 (14G2a antibodies; 5 μg/ml; see Methods) is shown in (A). Filled histograms (red color) show staining with anti-GD2 mAbs, empty histograms – staining with an isotype control. Confocal imaging of EL-4, IMR-32, and mS cells stained with anti-GD2 conjugated with AlexaFluor488 (14G2a antibodies; 5 μg/ml; see Methods) is shown in (B). The staining with anti-GD2 mAb is shown in green color; the nuclei were counterstained with Hoechst 33342 (shown in blue). Bar scale: 50 μm.
Figure 2
Figure 2
Quantitative analysis of the total ganglioside content and proportion of ganglioside GD2. HPTLC analysis of individual gangliosides in EL-4 cells was performed as described in Methods and shown in (A). Ratio of ganglioside GD2 to the total amount of gangliosides in the different tumor cell lines is shown in (B). The total cellular ganglioside content was determined as the sum of individual gangliosides measured by HPTLC densitometry.
Figure 3
Figure 3
The cytotoxic effects of two types of anti-GD2 antibodies on GD2-positive tumor cell lines. Phase-contrast images of GD2-positive tumor cell lines EL-4, IMR-32, and mS after 24 h of incubation with or without anti-GD2 mAbs, 14G2a (5 μg/ml) and ME361 (5 μg/ml) are shown in (A). In (A), bar scale: 50 μm. Analysis of DNA fragmentation (PI assay; see Methods) of GD2-positive tumor cells EL-4, IMR-32, mS treated with GD2 mAbs 14G2a (5 μg/ml) and ME361 (5 μg/ml) is shown in (B). In (B), the percentages of the cells with fragmented DNA in hypodiploid peaks are shown for each histogram.
Figure 4
Figure 4
Comparison of the influence of anti-GD2 antibodies on viability of GD2-positive vs. GD2-negative tumor cell lines. The viability of GD2-positive (EL-4, IMR-32, mS) and GD2-negative (Neuro-2A, A375, Jurkat) tumor cells was assessed for the cells incubated with various concentration of anti-GD2 mAbs for 72 h using MTT assay as described in Methods. Results are shown for two monoclonal anti-GD2 antibodies 14G2a (A) and ME361 (B). Mean ± S.E. of three separate experiments is shown, statistical analysis was performed using two-way analysis of variance method for concentrations of 0.31 – 10 μg/ml (A), and for concentrations 2.5 – 10 μg/ml (B). The differences between GD2-positive and GD2-negative groups were statistically significant (***, P < 0.001) as determined by Student-Newman-Keuls post-hoc analysis.
Figure 5
Figure 5
Analysis of apoptotic volume decrease and the loss of plasma membrane integrity for EL-4 lymphoma cells treated with anti-GD2 antibodies. Apoptotic volume decrease (AVD) (A) and cell membrane permeability (B) were analyzed for the control (untreated) EL-4 cells or after 2 h of incubation with anti-GD2 mAbs 14G2a (5 μg/ml), or Staurosporine (500 nM) that was used as positive control for induction of apoptosis (see Methods). In (A), R1 – region of viable cells, R2 – region of cells with AVD, and R3 – region of cell debris. In (B), percentages of 7-AAD positive cells are shown for each histogram.
Figure 6
Figure 6
Analysis of caspase-3 activation and mitochondria involvement during the cell death induced by anti-GD2 antibodies. Enzymatic activity of caspase-3 in control (untreated) EL-4 cells, or treated with anti-GD2 mAbs 14G2a (5 μg/ml), or staurosporine (50 nM) for 24 h is shown in (A). Mean ± S.E. of three separate experiments is shown. The statistical analysis was performed using two way analysis of variance method. There was a statistically significant differences between groups (P ≤ 0.001), *** P < 0.001 as determined by multiple comparisons of experimental versus control groups using Dunnett's post-hoc analysis. Effect of Pan-caspase inhibitor Z-VAD-FMK (10 μM) on cell death induced by anti-GD2 mAbs 14G2a (5 μg/ml) and Staurosporine (50 nM) after 24 h of incubation with EL-4 cells is shown in (B). Statistical analysis was performed using Mann–Whitney rank sum test, the differences between control and pan-caspase inhibitor groups were statistically significant (*, P < 0.05; ***, P < 0.001). Effect of anti-GD2 mAbs 14G2a (5 μg/ml) and staurosporine (50 nM) on ΔΨm of AVD-positive and 7AAD-negative populations of EL-4 cells. Representative density plots of flow cytometry analysis of mitochonodrial potential (MPT) measured by using JC-1 probe (2 μg/ml) in intact versus the cells incubated with anti-GD2 mAbs 14G2a (5 μg/ml) or staurosporine (500 nM) for 2 h is shown. (C). Representative density plots of MPT measured by using DioC6(3) probe (20 nM) in intact and cells incubated with anti-GD2 mAbs 14G2a (5 μg/ml) or staurosporine (500 nM) for 2 h is shown (D).
Figure 7
Figure 7
Cross-reactivity of anti-GD2 antibodies with ALCAM adhesion molecule. Flow cytometry analysis of EL-4, Jurkat and L1210 cells stained with anti-ALCAM (С20) antibodies is shown in (A), and staining with anti-GD2 14G2a antibodies is shown in (B) . In (A, B) filled histograms show staining with anti-GD2 mAbs, empty histograms – staining with secondary control antibodies.
Figure 8
Figure 8
Cross-reactivity of anti-GD2 antibodies with gangliosides GM1, GM2, GD1b and GD3. (A, B) Interaction of anti-GD2 antibodies with gangliosides GD2 vs. GM1, GM2, GD1b and GD3 was assessed by ELISA as described in Methods. Plates were coated with gangliosides GD2, GM1, GM2, GD1b, and GD3 (0.25 μg/well) and incubated with two types of anti-GD2 mAbs (0.156 - 10 μg/ml) ME361 (A) and 14G2a (B). In (A), the level of cross-reactivity is presented as the ratio for GM2, GD1b and GD3 binding to that of GD2. Mean ± S.E. of three separate experiments are shown, statistical analysis was performed using two-way analysis of variance method. There was a statistically significant difference between groups (P ≤ 0.001), ***P <0.001 as determined by multiple comparisons versus zero cross-reactivity by Dunnett's post-hoc analysis (A). In (B), multiple comparisons were not performed, since the values of the cross-reactivity were less than 2%.
Figure 9
Figure 9
Analysis of susceptibility of EL-4 cells with down-modulated GD2 to cell death induced by anti-GD2 antibodies. Cell viability (MTT assay, see Methods) of EL-4 cells treated with various concentrations of PDMP (2.5-100 μM) is shown in (A). Flow cytometry analysis of GD2 expression in the control cells vs. the cells with inhibited GD2 biosynthesis (with PDMP or siRNA GM2/GD2 synthase) is shown as the ratio of MFI of cells with reduced GD2 expression to MFI of control cells (B). The expression of GM2/GD2 synthase on mRNA level is shown in (C). The expression of GM2/GD2 synthase on a protein level in EL-4 cells transfected with siRNA that target GM2/GD2 synthase is shown in (D). Cytotoxic effects of anti-GD2 mAb 14G2a (5 μg/ml) on control EL-4 cells vs. cells with inhibited GD2 expression is shown in (E). In (C), RNA from control cells and cells transfected with GM2/GD2 synthase siRNA was isolated, and the expression of mRNA for GM2/GD2 synthase was determined by real time RT-PCR as described in Methods. In (D), expression of GM2/GD2 synthase was analyzed by Western blot as described in Methods. In (E), cytotoxicity was analyzed by PI assay as described in Methods.

Similar articles

Cited by

References

    1. Svennerholm L, Boström K, Fredman P, Jungbjer B, Lekman A, Mansson JE, Rynmark BM. Gangliosides and allied glycosphingolipids in human peripheral nerve and spinal cord. Biochim Biophys Acta. 1994;1214:115–123. doi: 10.1016/0005-2760(94)90034-5. - DOI - PubMed
    1. Schulz G, Cheresh DA, Varki NM, Yu A, Staffileno LK, Reisfeld RA. Detection of ganglioside GD2 in tumor tissues and sera of neuroblastoma patients. Cancer Res. 1984;44:5914–5920. - PubMed
    1. Wu ZL, Schwartz E, Seeger R, Ladisch S. Expression of GD2 ganglioside by untreated primary human neuroblastomas. Cancer Res. 1986;46:440–443. - PubMed
    1. Tsuchida T, Saxton RE, Morton DL, Irie RF. Gangliosides of human melanoma. J Natl Cancer Inst. 1987;78:45–54. - PubMed
    1. Chang HR, Cordon-Cardo C, Houghton AN, Cheung NK, Brennan MF. Expression of disialogangliosides GD2 and GD3 on human soft tissue sarcomas. Cancer. 1992;70:633–638. doi: 10.1002/1097-0142(19920801)70:3<633::AID-CNCR2820700315>3.0.CO;2-F. - DOI - PubMed

Publication types

MeSH terms