Review
. 2014 Jul 9;114(13):6589-631.
doi: 10.1021/cr400525m. Epub 2014 Apr 29.

Classification of intrinsically disordered regions and proteins

Affiliations
Review

Classification of intrinsically disordered regions and proteins

Robin van der Lee et al. Chem Rev. .
No abstract available


Figures

Figure 1
Figure 1
Structured domains and intrinsically disordered regions (IDRs) are two fundamental classes of functional building blocks of proteins. The synergy between disordered regions and structured domains increases the functional versatility of proteins. Adapted with permission from ref (50). Copyright 2012 American Association for the Advancement of Science.
Figure 2
Figure 2
The number of protein-coding genes in the human genome with various amounts of disorder. Histograms of the numbers of human genes with annotation (A) and without annotation (B), grouped by the percentage of disordered residues. (C) A comparison of the fraction of annotated and unannotated human genes with different amounts of disorder. Residues in each protein are defined as disordered when there is a consensus between >75% of the predictors in the D2P2 database at that position. The set of human genes was taken from Ensembl release 63, and the representative protein coded for by the longest transcript was used in each case. The annotation was taken from the description field with “open reading frame”, “hypothetical”, “uncharacterized”, and “putative protein” treated as no annotation.
Figure 3
Figure 3
The fraction of disordered residues located in domains in human protein-coding genes: (A) residues inside (left) and outside (right) of SCOP domains, and (B) residues inside (left) and outside (right) of Pfam domains (only curated Pfam domains were considered, i.e., Pfam-A). The SCOP domains in human proteins are defined by the SUPERFAMILY database. Disordered residues were taken from the D2P2 database (when there is a consensus between >75% of the disorder predictors). The set of human genes was taken from Ensembl release 63.
Figure 4
Figure 4
Functional classification scheme of IDRs. The function of disordered regions can stem directly from their highly flexible nature, when they fulfill entropic chain functions (such as linkers and spacers, indicated in dark-tone red), or from their ability to bind to partner molecules (proteins, other macromolecules, or small molecules). In the latter case, they bind either transiently as display sites of post-translational modifications or as chaperones (indicated in green), or they bind permanently as effectors, assemblers, or scavengers (indicated in dark-tone blue). More extensive descriptions and examples are found in the main text. Adapted with permission from ref (58). Copyright 2005 Elsevier.
Figure 5
Figure 5
Functional classification of IDRs according to their interaction features. (A) The flexibility of IDRs facilitates access to enzymes that catalyze post-translational modifications and effectors that bind these PTMs. This permits combinatorial regulation and reuse of the same components in multiple biological processes. (B) The availability of molecular recognition features and linear motifs within the IDRs enables the fishing for (“fly casting”) and gathering of different partners. (C) Conformational variability enables a nearly perfect molding to fit the binding interfaces of very diverse interaction partners. Context-dependent folding of an IDR can activate signaling processes in one case or inhibit them in another, resulting in completely different outcomes. Adapted with permission from ref (39). Copyright 2009 Elsevier.
Figure 6
Figure 6
Functional classification of linear motifs. Linear motifs can be divided into two major families, which each have three further subgroups. The modification class motifs all act as recognition sites for enzyme active sites, whereas the ligand class motifs are always recognized by the binding surface of a protein partner. More detailed classification beyond the graph shown here is possible. For example, an important subgroup of docking motifs are the degrons, which regulate protein stability by recruiting members of the ubiquitin–proteasome system. In the regular expressions, x corresponds to any amino acid, while other letters represent single letter codes of amino acids; letters within square brackets mean either residue is allowed in that position.
Figure 7
Figure 7
Classification of molecular recognition features (MoRFs) based on the secondary structure of the bound state. MoRFs (red ribbons) undergo disorder-to-order transition upon binding their partners (blue surfaces). (A) α-MoRF. BH3 domain of BAD (MoRF) bound to bcl-xl (partner) (PDB ID: 1G5J). (B) β-MoRF. Inhibitor of apoptosis protein DIAP1 (partner) bound to N-terminus of cell death protein GRIM (MoRF) (PDB ID: 1JD5). (C) ι-MoRF. AP-2 (partner) bound to the recognition motif of amphiphysin (MoRF) (PDB ID: 1KY7). (D) Complex-MoRF. Phosphotyrosine-binding domain (PTB) of the X11 protein (partner) bound to amyloid β A4 protein (MoRF) (PDB ID: 1X11). Note that the PTB domain of X11 actually binds unphosphorylated peptides and is a PTB by sequence similarity. Panels A–D reprinted with permission from ref (122). Copyright 2007 American Chemical Society. (E) Promiscuity of disorder-controlled interactions illustrated by the p53 interaction network. A structure versus disorder prediction on the p53 amino acid sequence is shown in the center of the figure (up = disorder, down = order) along with the structures of various regions of p53 bound to 14 different partners. The predictions for a central region of structure, and the disordered amino and carbonyl termini have been confirmed experimentally for p53. The various regions of p53 are color coded to show their structures in the complex and to map the binding segments to the amino acid sequence. Starting with the p53–DNA complex (top, left, magenta protein, blue DNA), and moving in a clockwise direction, the Protein Data Bank IDs and partner names are given as follows for the 14 complexes: (1tsr – DNA), (1gzh – 53BP1), (1q2d – gcn5), (3sak – p53 (tetramerization domain)), (1xqh – set9), (1h26 – cyclin A), (1ma3 – sirtuin), (1jsp – CBP bromo domain), (1dt7 – s100ββ), (2h1l – sv40 Large T antigen), (1ycs – 53BP2), (2gs0 – PH), (1ycr – MDM2), and (2b3g – RPA70). Reprinted with permission from ref (40). Copyright 2010 Elsevier.
Figure 8
Figure 8
Schematic representation of the continuum model of protein structure. The color gradient represents a continuum of conformational states ranging from highly dynamic, expanded conformational ensembles (red) to compact, dynamically restricted, fully folded globular states (blue). Dynamically disordered states are represented by heavy lines, stably folded structures as cartoons. A characteristic of IDPs is that they rapidly interconvert between multiple states in the dynamic conformational ensemble. In the continuum model, the proteome would populate the entire spectrum of dynamics, disorder, and folded structure depicted.
Figure 9
Figure 9
The protein quartet model of protein conformational states. In accordance with this model, protein function arises from four types of conformations of the polypeptide chain (ordered forms, molten globules, pre-molten globules, and random coils) and transitions between any of these states.
Figure 10
Figure 10
Original and modified diagram-of-states to classify predicted conformational properties of IDPs (and IDRs modeled as IDPs). (A) The original diagram predicts that sequences with a net charge per residue above 0.25 will be swollen coils. The three axes denote the fraction of positively charged residues, f+, the fraction of negatively charged residues, f, and the hydropathy. All three parameters are calculated from the amino acid composition. Green dots correspond to 364 curated disordered sequences extracted from the DisProt database. These sequences have hydropathy values that designate them as being disordered; that is, they lie in the bottom portion of the pyramid by definition. Additional filters were used for chain length (more than 30 residues) and the fraction of proline residues (fpro < 0.3). 97% of sequences used in this annotation have a net charge per residue of less than 0.26 and are thus predicted to be globule formers. Adapted from ref (166). Copyright 2010 National Academy of Sciences of the United States of America. (B) Modified diagram-of-states from panel (A) with a focus only on the bottom portion of the pyramid (i.e., stipulating that the hydropathy is low enough to be ignored). The polyampholytic contribution expands the space encompassed by nonglobule-formers by subdividing the disordered globules space in panel (A) into three distinct regions of which sequences in regions 2 and 3 actually may not form globules. In these polyampholytic regions, one has to account for the total charge, in terms of the fraction of charged residues (FCR), as well as the net charge per residue (NCPR) as opposed to NCPR alone. Conformations in regions 2 and 3 are expected to be random-coil-like if oppositely charged residues are well mixed in the linear sequence. Otherwise, one can expect compact or semicompact conformations. The classification scheme uses only the amino acid sequence as input. Reprinted with permission from ref (204). Copyright 2013 National Academy of Sciences of the United States of America.
Figure 11
Figure 11
Classification of fuzzy complexes by topology (upper panel) and by mechanism (lower panel). Blue arrows indicate interactions between fuzzy disordered regions and structured molecules. Protein Data Bank identifiers for the structures are given in parentheses. Topological categories: (A) Polymorphic. The WH2 domain of ciboulot interacts with actin in alternative locations: via an 18-residue segment (3u9z) or via only three residues (2ff3). The flanking regions remain dynamically disordered. (B) Clamp. The Oct-1 transcription factor has a bipartite DNA recognition motif. The two globular binding domains are connected by a 23 residue long disordered linker (1hf0), shortening of which reduces binding affinity. (C) Flanking. The p27Kip1 cell-cycle kinase inhibitor binds to the cyclin–Cdk2 complex (1jsu). The kinase binding site is flanked by a ∼100 residue long disordered linker, which enables T187 at the C-terminus to be phosphorylated. (D) Random. UmuD2 is a dimer that is produced from UmuD by RecA-facilitated self-cleavage (1i4v). The resulting proteins exhibit a random coil signal in circular dichroism experiments at physiologically relevant concentrations. Mechanistic categories: (E) Conformational selection. The fuzzy N-terminal acidic tail of the Max transcription factor (1nkp) facilitates formation of the DNA binding helix (dark red) of the leucine zipper basic helix–loop–helix (bHLH) motif. (F) Flexibility modulation. The disordered serine/arginine-rich region of the Ets-1 transcription factor (1mdm) changes DNA binding affinity by 100–1000-fold by modulating the flexibility of the binding segment via transient interactions. (G) Competitive binding. The acidic fuzzy C-terminal tail of high-mobility group protein B1 (2gzk) competes with DNA for the positively charged binding surfaces. (H) Tethering. The binding of the virion protein 16 activation domain to the human transcriptional coactivator positive cofactor 4 (2phe) is facilitated by acidic disordered regions, which anchor the binding segments.
Figure 12
Figure 12
A portrait gallery of disorder-based complexes. Illustrative examples of various interaction modes of intrinsically disordered proteins are shown. Protein Data Bank identifiers for the structures are given in parentheses. (A) MoRFs. Aa, α-MoRF, a complex between the botulinum neurotoxin (red helix) and its receptor (a blue cloud) (2NM1); Ab, ι-MoRF, a complex between an 18-mer cognate peptide derived from the α1 subunit of the nicotinic acetylcholine receptor from Torpedo californica (red helix) and α-cobratoxin (a blue cloud) (1LXH). (B) Wrappers. Ba, rat PP1 (blue cloud) complexed with mouse inhibitor-2 (red helices) (2O8A); Bb, a complex between the paired domain from the Drosophila paired (prd) protein and DNA (1PDN). (C) Penetrator. Ribosomal protein s12 embedded into the rRNA (1N34). (D) Huggers. Da, E. colitrp repressor dimer (1ZT9); Db, tetramerization domain of p53 (1PES); Dc, tetramerization domain of p73 (2WQI). (E) Intertwined strings. Ea, dimeric coiled coil, a basic coiled-coil protein from Eubacterium eligens ATCC 27750 (3HNW); Eb, trimeric coiled coil, salmonella trimeric autotransporter adhesin, SadA (2WPQ); Ec, tetrameric coiled coil, the virion-associated protein P3 from Caulimovirus (2O1J). (F) Long cylindrical containers. Fa, pentameric coiled coil, side and top views of the assembly domain of cartilage oligomeric matrix protein (1FBM); Fb, side and top views of the seven-helix coiled coil, engineered version of the GCN4 leucine zipper (2HY6). (G) Connectors. Ga, human heat shock factor binding protein 1 (3CI9); Gb, the bacterial cell division protein ZapA from Pseudomonas aeruginosa (1W2E). (H) Armature. Ha, side and top views of the envelope glycoprotein GP2 from Ebola virus (2EBO); Hb, side and top views of a complex between the N- and C-terminal peptides derived from the membrane fusion protein of the Visna (1JEK). (I) Tweezers or forceps. A complex between c-Jun, c-Fos, and DNA. Proteins are shown as red helices, whereas DNA is shown as a blue cloud (1FOS). (J) Grabbers. Structure of the complex between βPIX coiled coil (red helices) and Shank PDZ (blue cloud) (3L4F). (K) Tentacles. Structure of the hexameric molecular chaperone prefoldin from the archaeum Methanobacterium thermoautotrophicum (1FXK). (L) Pullers. Structure of the ClpB chaperone from Thermus thermophilus (1QVR). (M) Chameleons. The C-terminal fragment of p53 gains different types of secondary structure in complexes with four different binding partners, cyclin A (1H26), sirtuin (1MA3), CBP bromo domain (1JSP), and s100ββ (1DT7). Panels A–M reprinted with permission from ref (257). Copyright 2011 The Royal Society of Chemistry. (N) Dynamic complexes. Schematic representation of the polyelectrostatic model of the Sic1–Cdc4 interaction. An IDP (ribbon) interacts with a folded receptor (gray shape) through several distinct binding motifs and an ensemble of conformations (indicated by four representations of the interaction). The intrinsically disordered protein possesses positive and negative charges (depicted as blue and red circles, respectively) giving rise to a net charge ql, while the binding site in the receptor (light blue) has a charge qr. The effective distance ⟨r⟩ is between the binding site and the center of mass of the intrinsically disordered protein. Panel N was reprinted with permission from ref (243). Copyright 2010 John Wiley & Sons, Inc.
Figure 13
Figure 13
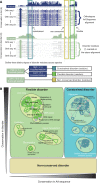
Classification of disordered regions according to their evolutionary conservation (constrained, flexible, and nonconserved disorder). (A) Schematic of computing disorder conservation and amino acid sequence conservation. The alignments are used to calculate the percentage of sequences in which a residue is disordered and the percentage of sequences in which the amino acid itself is conserved. A residue is considered to be conserved disordered if the property of disorder is conserved in at least one-half of the species. Similarly, the amino acid type of a residue is considered conserved if it is present in at least one-half of the species. Disordered residues in which both sequence and disorder are conserved are referred to as constrained disorder. Disordered residues in which disorder is conserved but not the amino acid sequence are referred to as flexible disorder. Residues that are disordered in S. cerevisiae but not cases of conserved disorder are referred to as nonconserved disorder. (B) Disorder splits into three distinct phenomena. Functional enrichment maps of proteins enriched in flexible disorder versus constrained disorder. The area of each rectangle is proportional to the occurrence of that type of disorder in the alignments. Related gene ontology terms are grouped based on gene overlap. Reprinted with permission from ref (54). Copyright 2011 Springer Science + Business Media.
Figure 14
Figure 14
Repeat expansion creates IDRs. IDRs are abundant in repeating sequence elements, which suggests that repeat expansion is an important mechanism by which genetic material encoding for structural disorder is generated. The expanding repeats may fall into three classes (types) in terms of their functional diversification following expansion. Individual repeats may remain functionally equivalent (type I), or diversify (type II), or collectively acquire a completely new function (type III). Dark-tone red indicates structural disorder of the repeat, which may undergo full (dark-tone blue) or partial (green) induced folding upon binding to a partner. Adapted with permission from ref (61). Copyright 2003 John Wiley & Sons, Inc.
Figure 15
Figure 15
A summary of expression–function trends for human transcripts encoding highly disordered proteins. The x-axis represents the log10 number of tissues in which the transcript is expressed; the y-axis represents the log10 average magnitude of expression within the tissues. From the data, five distinct functional classes of highly disordered human proteins become apparent. Adapted with permission from ref (208). Copyright 2009 Springer Science + Business Media.
Figure 16
Figure 16
Transcriptional and post-transcriptional gene regulation can be informative of IDR function. How inclusion of exons that code for IDRs is regulated during gene transcription and alternative splicing can give insights into the functional roles of the encoded disordered regions. For example, tissue- or developmental-specific regulation of alternative splicing or alternative promoter and polyadenylation site usage can be associated with important roles of the encoded IDRs in protein regulation and cellular interactions through, for example, the presence of binding motifs and phosphosites. Additionally, information on the conservation of patterns of exon inclusion (i.e., events shared among different evolutionary lineages versus species-specific events) can aid in better characterization of the encoded IDRs. The figure illustrates a hypothetical example where an exon (largest red box) that is included in a tissue-specific manner both in human and in mouse encodes an IDR that embeds a phosphosite (P) and is involved in protein regulation. The human gene depicted in the figure has an additional exon (smallest red box), which encodes an IDR with a short interaction motif and which is also included in a tissue-specific manner in humans. Gene structures, mature mRNAs, and corresponding protein isoforms are shown for human and mouse brain and heart tissues. On the right, possible functional roles of the IDRs encoded by the brain isoforms are illustrated. The examples illustrate how protein functional space can increase due to alternative splicing of exons that encode IDRs. Adapted with permission from ref (304). Copyright 2012 Elsevier.
Figure 17
Figure 17
Involvement of IDRs in phase transitions. (A) Interactions between proteins that contain multiple copies of a specific domain (an SH3 domain in the figure) and IDRs with multiple instances of its interaction motif (proline-rich SH3 motif here) can, at appropriate concentrations, produce sharp liquid–liquid-demixing phase separations. This phase transition is likely to increase local “active” protein concentrations exploitable for signaling switches. (B) High concentrations of low-complexity IDRs found in certain RNA binding domains lead to a reversible phase transition with the formation of highly dynamic hydrogels. These RNA granule-like assemblies consist of heteromeric protein aggregates and allow localization and storage of functionally related but nonidentical RNA molecules. Adapted from ref (100). Copyright 2013 the Biochemical Society.
Figure Box 4
Figure Box 4
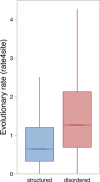
Boxplots of the distributions of evolutionary rates for predicted structured (blue) and disordered (red) residues across the human proteome. Residues with a high evolutionary rate are less conserved. Boxes represent the 50% of data points in the two quartiles above and below the median (the horizontal bar within each box). Vertical lines (whiskers) connected to the boxes represent the highest and lowest nonoutlier data points, with outliers being defined as >1.5 times the interquartile range from the median. Outliers are not shown for visual clarity.

Similar articles

Cited by

References

    1. Flicek P.; Ahmed I.; Amode M. R.; Barrell D.; Beal K.; Brent S.; Carvalho-Silva D.; Clapham P.; Coates G.; Fairley S.; Fitzgerald S.; Gil L.; Garcia-Giron C.; Gordon L.; Hourlier T.; Hunt S.; Juettemann T.; Kahari A. K.; Keenan S.; Komorowska M.; Kulesha E.; Longden I.; Maurel T.; McLaren W. M.; Muffato M.; Nag R.; Overduin B.; Pignatelli M.; Pritchard B.; Pritchard E.; Riat H. S.; Ritchie G. R.; Ruffier M.; Schuster M.; Sheppard D.; Sobral D.; Taylor K.; Thormann A.; Trevanion S.; White S.; Wilder S. P.; Aken B. L.; Birney E.; Cunningham F.; Dunham I.; Harrow J.; Herrero J.; Hubbard T. J.; Johnson N.; Kinsella R.; Parker A.; Spudich G.; Yates A.; Zadissa A.; Searle S. M. Nucleic Acids Res. 2013, 41, D48. - PMC - PubMed
    1. Nucleic Acids Res. 2013, 41, D8. - PMC - PubMed
    1. Kolodny R.; Pereyaslavets L.; Samson A. O.; Levitt M. Annu. Rev. Biophys. 2013, 42, 559. - PubMed
    1. Raes J.; Harrington E. D.; Singh A. H.; Bork P. Curr. Opin. Struct. Biol. 2007, 17, 362. - PubMed
    1. Jaroszewski L.; Li Z.; Krishna S. S.; Bakolitsa C.; Wooley J.; Deacon A. M.; Wilson I. A.; Godzik A. PLoS Biol. 2009, 7, e1000205. - PMC - PubMed

Publication types

MeSH terms

Substances