On-the-fly Numerical Surface Integration for Finite-Difference Poisson-Boltzmann Methods
- PMID: 24772042
- PMCID: PMC3998210
- DOI: 10.1021/ct200389p
On-the-fly Numerical Surface Integration for Finite-Difference Poisson-Boltzmann Methods
Abstract
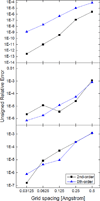
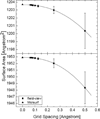
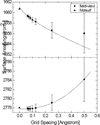
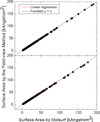
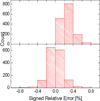
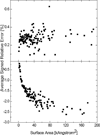
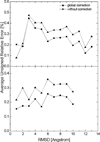
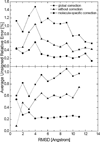
Most implicit solvation models require the definition of a molecular surface as the interface that separates the solute in atomic detail from the solvent approximated as a continuous medium. Commonly used surface definitions include the solvent accessible surface (SAS), the solvent excluded surface (SES), and the van der Waals surface. In this study, we present an efficient numerical algorithm to compute the SES and SAS areas to facilitate the applications of finite-difference Poisson-Boltzmann methods in biomolecular simulations. Different from previous numerical approaches, our algorithm is physics-inspired and intimately coupled to the finite-difference Poisson-Boltzmann methods to fully take advantage of its existing data structures. Our analysis shows that the algorithm can achieve very good agreement with the analytical method in the calculation of the SES and SAS areas. Specifically, in our comprehensive test of 1,555 molecules, the average unsigned relative error is 0.27% in the SES area calculations and 1.05% in the SAS area calculations at the grid spacing of 1/2Å. In addition, a systematic correction analysis can be used to improve the accuracy for the coarse-grid SES area calculations, with the average unsigned relative error in the SES areas reduced to 0.13%. These validation studies indicate that the proposed algorithm can be applied to biomolecules over a broad range of sizes and structures. Finally, the numerical algorithm can also be adapted to evaluate the surface integral of either a vector field or a scalar field defined on the molecular surface for additional solvation energetics and force calculations.
Figures


Similar articles
-
Exploring accurate Poisson-Boltzmann methods for biomolecular simulations.Comput Theor Chem. 2013 Nov 15;1024:34-44. doi: 10.1016/j.comptc.2013.09.021. Comput Theor Chem. 2013. PMID: 24443709 Free PMC article.
-
Reducing grid-dependence in finite-difference Poisson-Boltzmann calculations.J Chem Theory Comput. 2012 Aug 14;8(8):2741-2751. doi: 10.1021/ct300341d. Epub 2012 Jun 18. J Chem Theory Comput. 2012. PMID: 23185142 Free PMC article.
-
On removal of charge singularity in Poisson-Boltzmann equation.J Chem Phys. 2009 Apr 14;130(14):145101. doi: 10.1063/1.3099708. J Chem Phys. 2009. PMID: 19368474
-
Influence of Grid Spacing in Poisson-Boltzmann Equation Binding Energy Estimation.J Chem Theory Comput. 2013 Aug 13;9(8):3677-3685. doi: 10.1021/ct300765w. J Chem Theory Comput. 2013. PMID: 23997692 Free PMC article.
-
Polarizable atomic multipole solutes in a Poisson-Boltzmann continuum.J Chem Phys. 2007 Mar 28;126(12):124114. doi: 10.1063/1.2714528. J Chem Phys. 2007. PMID: 17411115 Free PMC article. Review.
Cited by
-
Recent Developments in Free Energy Calculations for Drug Discovery.Front Mol Biosci. 2021 Aug 11;8:712085. doi: 10.3389/fmolb.2021.712085. eCollection 2021. Front Mol Biosci. 2021. PMID: 34458321 Free PMC article. Review.
-
Modeling Membrane Protein-Ligand Binding Interactions: The Human Purinergic Platelet Receptor.J Phys Chem B. 2016 Dec 8;120(48):12293-12304. doi: 10.1021/acs.jpcb.6b09535. Epub 2016 Nov 23. J Phys Chem B. 2016. PMID: 27934233 Free PMC article.
-
Heterogeneous Dielectric Implicit Membrane Model for the Calculation of MMPBSA Binding Free Energies.J Chem Inf Model. 2019 Jun 24;59(6):3041-3056. doi: 10.1021/acs.jcim.9b00363. Epub 2019 Jun 13. J Chem Inf Model. 2019. PMID: 31145610 Free PMC article.
-
Synergistic Modification Induced Specific Recognition between Histone and TRIM24 via Fluctuation Correlation Network Analysis.Sci Rep. 2016 Apr 15;6:24587. doi: 10.1038/srep24587. Sci Rep. 2016. PMID: 27079666 Free PMC article.
-
Calculating protein-ligand binding affinities with MMPBSA: Method and error analysis.J Comput Chem. 2016 Oct 15;37(27):2436-46. doi: 10.1002/jcc.24467. Epub 2016 Aug 11. J Comput Chem. 2016. PMID: 27510546 Free PMC article.
References
Grants and funding
LinkOut - more resources
Full Text Sources
