. 2014 Apr 24;9(4):e95443.
doi: 10.1371/journal.pone.0095443. eCollection 2014.

Pigment epithelium-derived factor 34-mer peptide prevents liver fibrosis and hepatic stellate cell activation through down-regulation of the PDGF receptor

Affiliations

Pigment epithelium-derived factor 34-mer peptide prevents liver fibrosis and hepatic stellate cell activation through down-regulation of the PDGF receptor

Tung-Han Tsai et al. PLoS One. .

Erratum in

  • PLoS One. 2014;9(9): doi/10.1371/journal.pone.0108835

Abstract

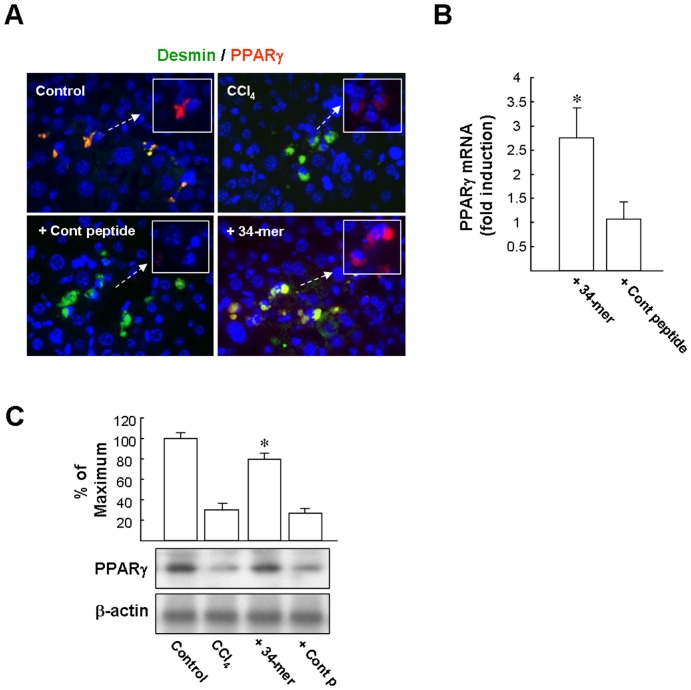
Pigment epithelium-derived factor (PEDF) has been shown previously to prevent liver fibrosis and hepatic stellate cell (HSC) activation. By investigating the functional domains in PEDF, we identified a 34-mer peptide (residues Asp44-Asn77) that harbors the same function as the full-length PEDF protein. Not only did the 34-mer suppress the development of fibrosis in carbon tetrachloride (CCl4)-treated mouse liver but it also upregulated peroxisome proliferator-activated receptor-gamma (PPARγ) expression in HSCs in vivo. Platelet-derived growth factor (PDGF) plays a crucial role on the process of HSC activation in response to liver damage. The 34-mer suppressed PDGF-induced cell proliferation and expression of myofibroblastic marker proteins in primary rat HSC culture, increased the levels of PPARγ mRNA and protein in a dose-dependent manner and markedly reduced the level of active β-catenin protein, an HSC activating factor, in HSC-T6 cells. Similarly, IWR-1, an inhibitor of the Wnt response, displayed the same effect as the 34-mer in preventing HSC-T6 activation. The Wnt signaling-mediated PPARγ suppression was abolished by both the IWR-1 inhibitor and a small interfering RNA (siRNA) targeting β-catenin and the Wnt coreceptor, LRP6. Both PEDF and the 34-mer down-regulated PDGF receptor-α/β expression and blocked the PDGF-induced phosphorylation of Akt and ERK. Moreover, the inhibitory effect on PDGF receptor expression was abolished by PPARγ antagonists and PPARγ siRNA. Our observations indicate that the PEDF-derived 34-mer peptide can mimic PEDF in attenuating HSC activation. Investigation of this 34-mer peptide led to the identification of a signaling mechanism involving PPARγ induction, suppression of Wnt/β-catenin signaling and down-regulation of the PDGF receptor-α/β.


Conflict of interest statement

Competing Interests: The authors have declared that no competing interests exist.

Figures

Figure 1
Figure 1. Suppression of CCl4-induced liver fibrosis by the 34-mer.
Liver fibrosis was induced by intraperitoneal injection of CCl4 twice a week for 3 weeks. The mice then received the 34-mer twice a week intraperitoneally and were continuously injected with CCl4 for further 4 weeks. (A) Histopathological detection of collagen in the liver by Sirius red-staining. (Original magnification, ×200). Representative pictures from at least 3 different experiments with six mice in each subgroup are shown. (B) Estimation of hepatic fibrosis area by Sirius red staining. Data were assessed by analyzing 10 Sirius red-stained liver sections per animal with a computerized image-plus system. *P<0.02 versus CCl4-treated 3 weeks-group; ** P<0.001 versus control peptide+CCl4-treated group. (C) Relative mRNA expression of PDGF isoforms and receptors in CCl4-treated mouse livers. CCl4 treatment was performed as described as above. The cycle threshold (Ct) value of the PCR product and a control mRNA (GAPDH) were used to calculate the relative quantities of mRNA between samples. Data represent means ± SD of 6 animals in each group. *P<0.05 versus untreated group. (D) Specimens were immunohistologically stained with α-SMA to observe activated HSCs (red color) and counterstained with Hoechst 33258 to observe nuclei. Original magnification, ×400. Scale bar  = 20 µM. Numbers of α-SMA-positive cells are expressed as α-SMA-positive cells/400× field. Results were evaluated from 6 sections per liver specimen, and 6 mice in each group. ** P<0.005 versus control peptide+CCl4-treated group. (E) qPCR analysis. The mRNA expression of TGFβ1, CoL1A1 and α-SMA was significantly attenuated by the 34-mer. The cycle threshold (Ct) value of the PCR product and a control mRNA (GAPDH) were used to calculate relative quantities of mRNA between samples. Data represent means ± SD of 6 animals in each group. **P<0.05 versus control peptide+CCl4-treated group.
Figure 2
Figure 2. The 34-mer induces PPARγ expression in activated HSCs in vivo.
Liver fibrosis was induced by intraperitoneal injection of CCl4 twice a week for 3 weeks. The mice were then injected with PEDF peptides every two days for a week. (A) Representative pictures of four independent experiments show dual-immunofluorescence staining of HSCs by desmin (green labeling), PPARγ (red labeling), and merged (yellow; PPARγ-positive HSCs). Original magnification, ×400. (B) PPARγ mRNA in liver extract assayed by qPCR. Relative mRNA expression levels were normalized to the GAPDH mRNA content. Data represent three independent experiments and six mice per group. *P<0.001 versus control peptide+CCl4-treated group. (C) Liver protein extracts were harvested and subjected to western blot analysis with antibodies as indicated. Representative blots and densitometric analysis from 3 independent experiments are shown. *P<0.05 versus control peptide+CCl4-treated group.
Figure 3
Figure 3. PEDF and the 34-mer inhibit HSC activation induced by PDGF.
HSC-T6 cells (A and B) and primary rat HSCs (C and D) were either untreated or pretreated with PEDF or the 34-mer for 2 days and then stimulated by PDGF (20 ng/ml) for 24 h. Representative western blots (A and C) and densitometric analysis with SD (B and D) from 3∼4 separate experiments are shown. *P<0.05 versus UT cells (column 1). **P<0.05 versus control peptide/PDGF-treated cells (column 5). (E) Immunofluorescence analysis. F-actin (red) and α-SMA (green) in primary rat HSCs were stained by rhodamine-conjugated phalloidin and anti-α-SMA antibody, respectively. DNA was visualized with Hoechst 33258 staining. Scale bar: 20 µM. Original magnification ×400. Representative images from three independent experiments. (F) BrdU labeling assay. BrdU-positive cells (red) were detected by immunofluorescence microscopy (original magnification, ×400). Variations shown represent SD from three independent experiments. *P<0.01 versus UT cells. **P<0.05 versus control peptide/PDGF-treated cells.
Figure 4
Figure 4. The34-mer induces PPARγ expression via suppression of Wnt signaling.
(A) qPCR. Cells were treated with various doses of the 34-mer for 24 h or pretreated with 5 ng/ml actinomycin D (Act D) for 1 h and then incubated with the 34-mer for an additional 24 h. Average levels of PPARγ mRNA from three repeats of experiments are shown. *P<0.005 versus UT cells. **P<0.005 versus 100 nM 34-mer-treated cells. (B) HSC-T6 cells were treated with the 34-mer at the indicated concentrations for 48 h and proteins were detected by western blot analysis with the antibodies indicated. Representative blots (below panels) and densitometric analysis with SD (upper figures) of three independent experiments are shown. *P<0.05 versus UT cells. The 34-mer suppresses β-catenin protein expression. HSC-T6 cells were exposed to the 34-mer or IWR-1 for 48 h and then total cell lysates were prepared for western blotting using the antibodies indicated. Representative blots (C) and densitometric analyses with SD (D) from four separate experiments are shown. *P<0.01 versus untreated cells; **P<0.05 versus untreated cells; (E) HSC-T6 cells were exposed to the 34-mer or IWR-1 for 48 h and then nuclear extracts were prepared and subjected to western blot analysis of nuclear β-catenin and PPARγ. Relative nuclear protein expression levels were normalized to histone H1. Representative blots from two independent experiments. (F and G) Suppression of Wnt signaling by β-catenin siRNA or LRP6 siRNA upregulates PPARγ expression in HSC-T6 cells. The cells were transfected with β-catenin, LRP6 siRNA or control siRNA for 16 h, allowed to recover in complete medium for a further 48 h and then were harvested for western blot analysis. “Mock” indicates that the cells were treated with transfection reagent alone. Representative blots from three independent experiments. (H) HSC-T6 cells were treated with Wnt3a at the indicated concentrations for 1 h and proteins were detected by western blot analysis with antibodies against the active phosphorylated form of LRP6 and active β-catenin. Equal protein loading was confirmed by reprobing the membranes with anti-LRP6 or β-actin antibodies. Representative blots from three separate experiments are shown. (I) The 34-mer suppresses Wnt3a-induced LRP6 phosphorylation and active β-catenin formation. HSC-T6 cells were treated with Wnt3a or co-treated with Wnt3a and the 34-mer/44-mer at the indicated concentrations for 1 h and then proteins were detected by western blot analysis with the antibodies indicated. Representative blots (left panels) and densitometric analysis with SD (right figures) of three independent experiments are shown. *P<0.005 versus Wnt3a-treated cells; **P<0.01 versus Wnt3a-treated cells.
Figure 5
Figure 5. PEDF and the 34-mer suppress PDGFR expression in HSC-T6 cells.
(A) qPCR. HSC-T6 cells were cultured in 1% FBS medium for 2 days (UT) or 1% FBS medium supplemented with PEDF, the 34-mer or 44-mer for 2 days before RNA extraction. The cycle threshold (Ct) value of the PDGFR-α and –β mRNA and a control GAPDH mRNA were used to calculate relative quantities of mRNA between samples. Average levels of PDGFR-α and –β mRNA from three repeats of experiments are shown. **P<0.002 versus the 44-mer control peptide-treated cells. (B) HSC-T6 cells were treated with the 34-mer at the indicated concentrations for 48 h and proteins were detected by western blot analysis with the antibodies indicated. Representative blots from three independent experiments are shown.
Figure 6
Figure 6. PEDF and 34-mer pretreatment suppress PDGF signaling.
(A) PDGF induces ERK and Akt phosphorylation in HSC-T6 cells. Cells were cultured in 1% FBS medium for 2 days and then exposed to fresh serum-free medium containing PDGF for the indicated time periods. Western blotting was performed to detect the active phosphorylated forms of ERK (p-ERK) and Akt (p-Akt) and is shown in the upper panels. Equal protein loading was confirmed by reprobing the membranes with total ERK and Akt antibodies as a loading control. Representative blots from three separate experiments are shown. (B) Treatment of HSC-T6 cells with PEDF or the 34-mer prevents ERK and Akt phosphorylation induced by PDGF. HSC-T6 cells were untreated or pretreated with PEDF or the 34-mer for 2 days and then stimulated with PDGF for the indicated time periods. Cells were harvested and subjected to western blot analysis with phosphospecific antibodies to ERK1/2 and Akt. (C and D) After densitometric scanning of triplicate blots, values for p-ERK2 and p-Akt were normalized to total ERK2 and Akt, respectively. **P<0.05 versus control peptide→PDGF-treated cells.
Figure 7
Figure 7. PEDF suppresses PDGFR expression by PPARγ.
(A and B) PPARγ antagonists suppress the inhibitory effect of PEDF on PDGFR-α and –β expression. HSCT-6 cells were treated with PEDF or the 34-mer in combination with 10 µM GW9662 or 10 µM G3335 for 48 h. Cells were harvested for western blot analysis. Equal loading was confirmed with antibodies against β-actin. Representative blots (below panels) and densitometric analysis with SD (upper figures) of three independent experiments are shown. **P<0.0001 versus untreated cells. (C and D) The effect of synthetic PPARγ ligands CGZ and RGZ on PDGFR-α/β expression. HSCT-6 cells were treated with the 34-mer, 5 µM PPARγ ligand or the 34-mer combined with CGZ or RGZ for 48 h. Cells were harvested for western blot analysis. Equal loading was confirmed with antibodies against β-actin. Representative blots (C) and densitometric analysis with SD (D) of three independent experiments are shown. *P<0.05 versus 34-mer-treated cells. **P<0.02 versus 34-mer-treated cells. (E) PPARγ siRNA abrogates PDGFR down-regulation induced by the 34-mer. HSC-T6 cells were transfected with a PPARγ siRNA or control siRNA for 16 h and allowed to recover in complete medium for a further 24 h. “Mock” indicates that cells were treated with transfection reagents alone. After treatment, the HSC-T6 and siRNA-transfected HSC-T6 cells were exposed to the 34-mer for 48 h and then harvested for western blot analysis. (F) BrdU pulse-labeling assay. GW9662 and siRNA pretreatment was performed as described above, followed by PDGF (P) treatment for an additional 24 h and BrdU pulse-labeling for 2 h. Variations shown represent SD from three independent experiments (n = 3 dishes).

Similar articles

Cited by

References

    1. Schmitt-Graff A, Kruger S, Bochard F, Gabbiani G, Denk H (1991) Modulation of alpha smooth muscle actin and desmin expression in perisinusoidal cells of normal and diseased human livers. Am J Pathol 138(5): 1233–1242. - PMC - PubMed
    1. Friedman SL (2000) Molecular regulation of hepatic fibrosis, an integrated cellular response to tissue injury. J Biol Chem 275(4): 2247–2250. - PubMed
    1. Rockey DC, Chung JJ (1996) Endothelin antagonism in experimental hepatic fibrosis. Implications for endothelin in the pathogenesis of wound healing. J Clin Invest 98(6): 1381–1388. - PMC - PubMed
    1. Andrae J, Gallini R, Betsholtz C (2008) Role of platelet-derived growth factors in physiology and medicine. Genes Dev 22(10): 1276–1312. - PMC - PubMed
    1. Pinzani M, Milani S, Herbst H, DeFranco R, Grappone C, et al. (1996) Expression of platelet-derived growth factor and its receptors in normal human liver and during active hepatic fibrogenesis. Am J Pathol 148(3): 785–800. - PMC - PubMed

Publication types

MeSH terms

Grants and funding

This work was supported by grants from the Tri-Service General Hospital (TSGH-C101-083, TSGH-C101-084), National Science Council, Taiwan (NSC 101-2314-B-195-006-MY3) and Mackay Memorial Hospital (MMH-E-101-006). The funders had no role in study design, data collection and analysis, decision to publish, or preparation of the manuscript.