Millisecond dynamics of RNA polymerase II translocation at atomic resolution
- PMID: 24753580
- PMCID: PMC4040580
- DOI: 10.1073/pnas.1315751111
Millisecond dynamics of RNA polymerase II translocation at atomic resolution
Abstract
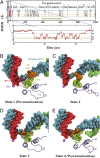
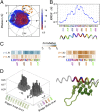
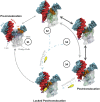
Transcription is a central step in gene expression, in which the DNA template is processively read by RNA polymerase II (Pol II), synthesizing a complementary messenger RNA transcript. At each cycle, Pol II moves exactly one register along the DNA, a process known as translocation. Although X-ray crystal structures have greatly enhanced our understanding of the transcription process, the underlying molecular mechanisms of translocation remain unclear. Here we use sophisticated simulation techniques to observe Pol II translocation on a millisecond timescale and at atomistic resolution. We observe multiple cycles of forward and backward translocation and identify two previously unidentified intermediate states. We show that the bridge helix (BH) plays a key role accelerating the translocation of both the RNA:DNA hybrid and transition nucleotide by directly interacting with them. The conserved BH residues, Thr831 and Tyr836, mediate these interactions. To date, this study delivers the most detailed picture of the mechanism of Pol II translocation at atomic level.
Keywords: Markov state model; molecular dynamics; trigger loop.
Conflict of interest statement
The authors declare no conflict of interest.
Figures


Comment in
-
Unveiling translocation intermediates of RNA polymerase.Proc Natl Acad Sci U S A. 2014 May 27;111(21):7507-8. doi: 10.1073/pnas.1406413111. Epub 2014 May 14. Proc Natl Acad Sci U S A. 2014. PMID: 24828529 Free PMC article. No abstract available.
Similar articles
-
Dynamics of bridge helix bending in RNA polymerase II.Proteins. 2017 Apr;85(4):614-629. doi: 10.1002/prot.25239. Epub 2017 Jan 23. Proteins. 2017. PMID: 28056486
-
Bridge helix bending promotes RNA polymerase II backtracking through a critical and conserved threonine residue.Nat Commun. 2016 Apr 19;7:11244. doi: 10.1038/ncomms11244. Nat Commun. 2016. PMID: 27091704 Free PMC article.
-
Structure of transcribing mammalian RNA polymerase II.Nature. 2016 Jan 28;529(7587):551-4. doi: 10.1038/nature16482. Epub 2016 Jan 20. Nature. 2016. PMID: 26789250
-
Molecular mechanisms of RNA polymerase II transcription elongation elucidated by kinetic network models.Curr Opin Struct Biol. 2018 Apr;49:54-62. doi: 10.1016/j.sbi.2018.01.002. Epub 2018 Feb 3. Curr Opin Struct Biol. 2018. PMID: 29414512 Review.
-
RNA polymerase II transcription: structure and mechanism.Biochim Biophys Acta. 2013 Jan;1829(1):2-8. doi: 10.1016/j.bbagrm.2012.09.003. Epub 2012 Sep 18. Biochim Biophys Acta. 2013. PMID: 23000482 Free PMC article. Review.
Cited by
-
DNA opening during transcription initiation by RNA polymerase II in atomic detail.Biophys J. 2022 Nov 15;121(22):4299-4310. doi: 10.1016/j.bpj.2022.10.012. Epub 2022 Oct 13. Biophys J. 2022. PMID: 36230000 Free PMC article.
-
Transient Structural Dynamics of Glycogen Phosphorylase from Nonequilibrium Hydrogen/Deuterium-Exchange Mass Spectrometry.J Am Chem Soc. 2024 Jan 10;146(1):298-307. doi: 10.1021/jacs.3c08934. Epub 2023 Dec 29. J Am Chem Soc. 2024. PMID: 38158228 Free PMC article.
-
Revealing atomic-scale molecular diffusion of a plant-transcription factor WRKY domain protein along DNA.Proc Natl Acad Sci U S A. 2021 Jun 8;118(23):e2102621118. doi: 10.1073/pnas.2102621118. Proc Natl Acad Sci U S A. 2021. PMID: 34074787 Free PMC article.
-
The origin of genetic and metabolic systems: Evolutionary structuralinsights.Heliyon. 2023 Mar 11;9(3):e14466. doi: 10.1016/j.heliyon.2023.e14466. eCollection 2023 Mar. Heliyon. 2023. PMID: 36967965 Free PMC article.
-
The Mechanisms of Substrate Selection, Catalysis, and Translocation by the Elongating RNA Polymerase.J Mol Biol. 2019 Sep 20;431(20):3975-4006. doi: 10.1016/j.jmb.2019.05.042. Epub 2019 May 31. J Mol Biol. 2019. PMID: 31153902 Free PMC article. Review.
References
-
- Cheung AC, Cramer P. A movie of RNA polymerase II transcription. Cell. 2012;149(7):1431–1437. - PubMed
-
- Westover KD, Bushnell DA, Kornberg RD. Structural basis of transcription: Nucleotide selection by rotation in the RNA polymerase II active center. Cell. 2004;119(4):481–489. - PubMed
-
- Kettenberger H, Armache KJ, Cramer P. Complete RNA polymerase II elongation complex structure and its interactions with NTP and TFIIS. Mol Cell. 2004;16(6):955–965. - PubMed
-
- Gnatt AL, Cramer P, Fu JH, Bushnell DA, Kornberg RD. Structural basis of transcription: An RNA polymerase II elongation complex at 3.3 A resolution. Science. 2001;292(5523):1876–1882. - PubMed
Publication types
MeSH terms
Substances
Grants and funding
LinkOut - more resources
Full Text Sources
Other Literature Sources

