

Trypanosoma cruzi infection down-modulates the immunoproteasome biosynthesis and the MHC class I cell surface expression in HeLa cells
- PMID: 24752321
- PMCID: PMC3994161
- DOI: 10.1371/journal.pone.0095977
Trypanosoma cruzi infection down-modulates the immunoproteasome biosynthesis and the MHC class I cell surface expression in HeLa cells
Abstract
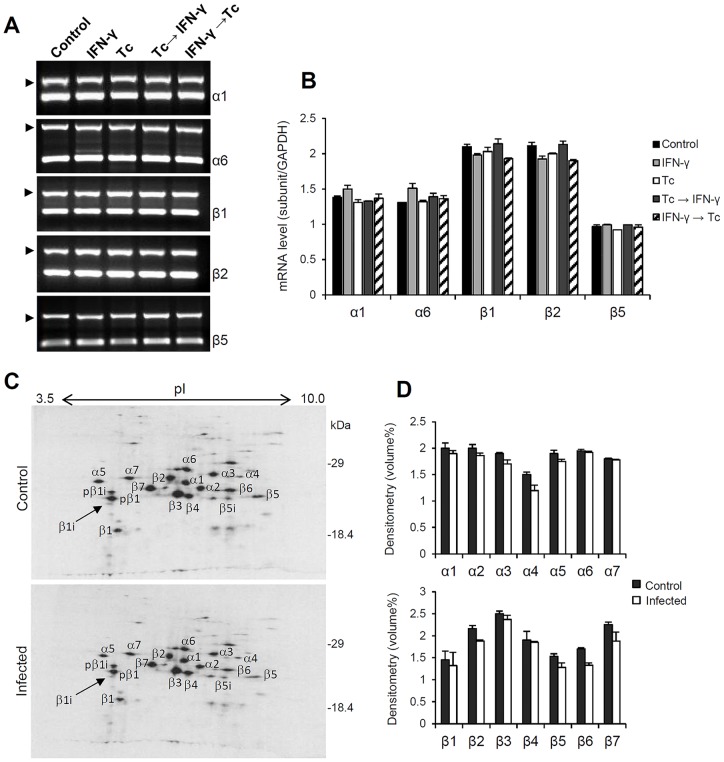
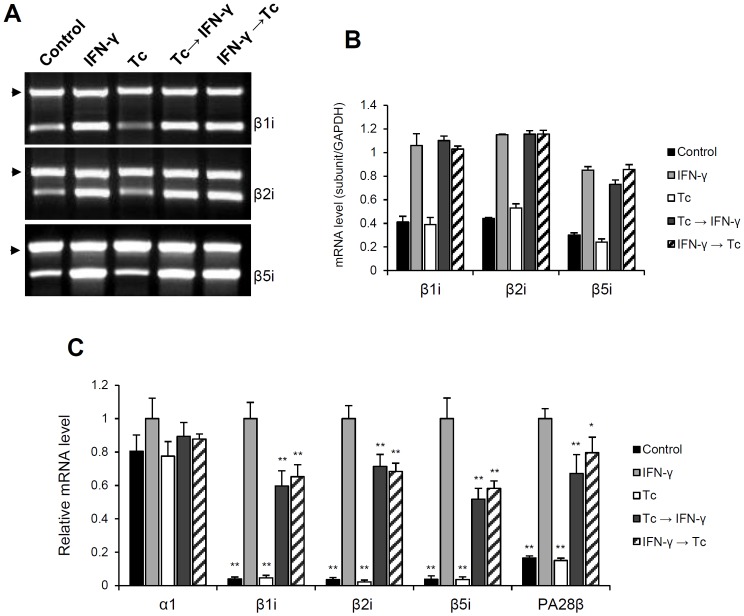
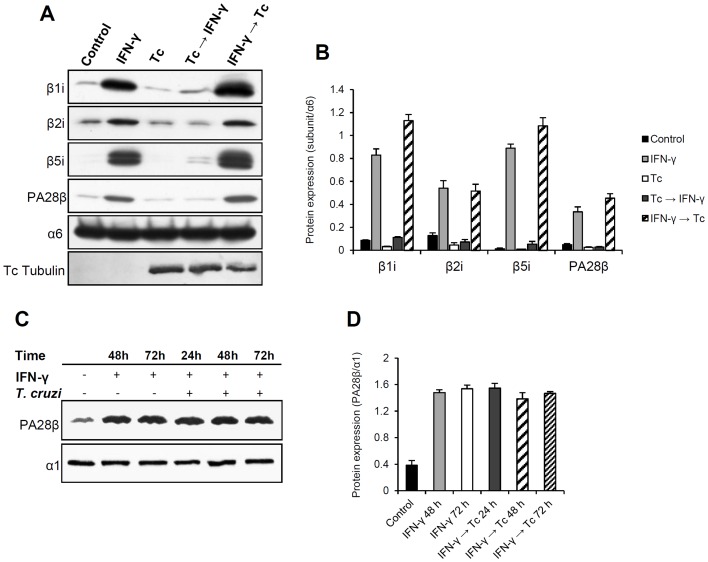
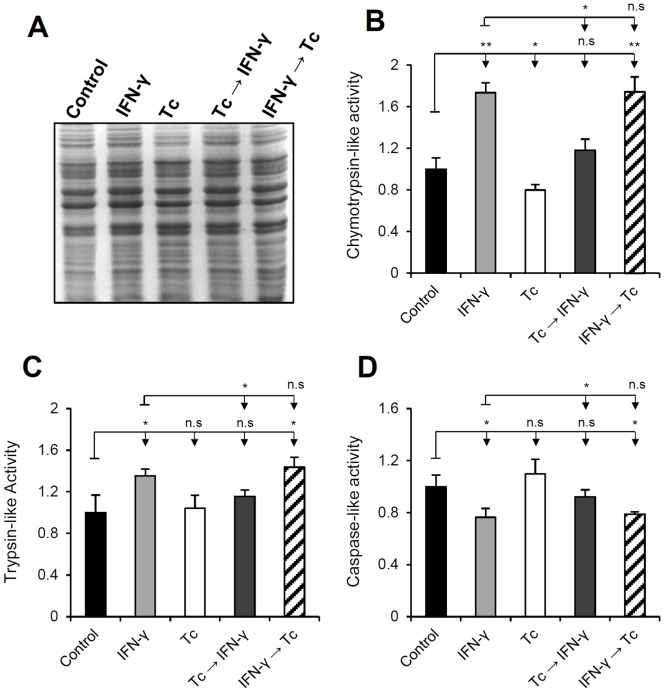
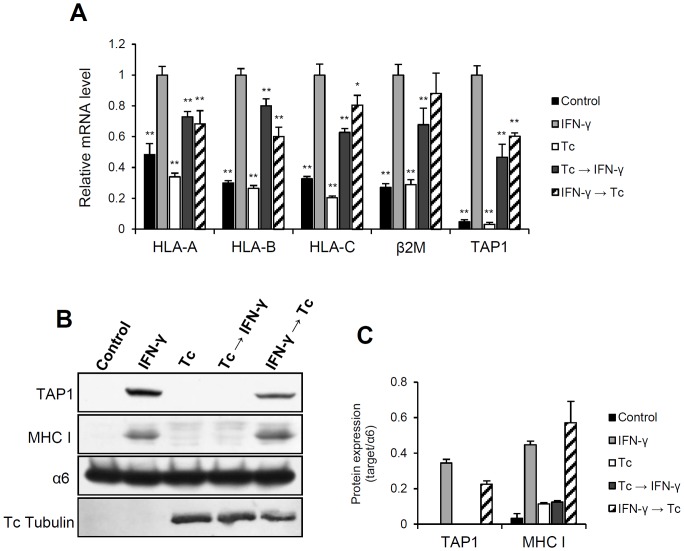
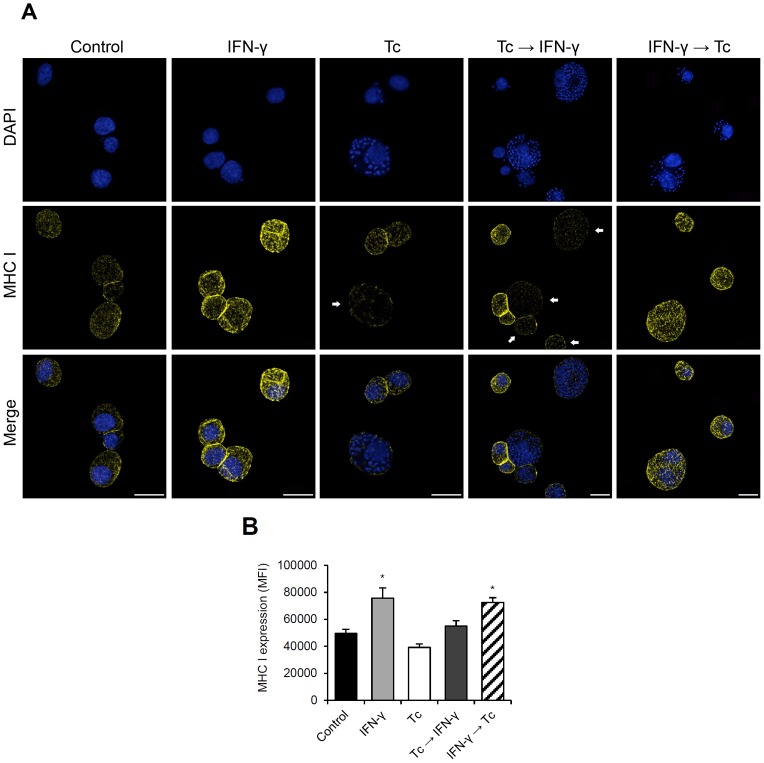
Generally, Trypanosoma cruzi infection in human is persistent and tends to chronicity, suggesting that the parasite evade the immune surveillance by down regulating the intracellular antigen processing routes. Within the MHC class I pathway, the majority of antigenic peptides are generated by the proteasome. However, upon IFN-γ stimulation, the catalytic constitutive subunits of the proteasome are replaced by the subunits β1i/LMP2, β2i/MECL-1 and β5i/LMP7 to form the immunoproteasome. In this scenario, we analyzed whether the expression and activity of the constitutive and the immunoproteasome as well as the expression of other components of the MHC class I pathway are altered during the infection of HeLa cells with T. cruzi. By RT-PCR and two-dimensional gel electrophoresis analysis, we showed that the expression and composition of the constitutive proteasome is not affected by the parasite. In contrast, the biosynthesis of the β1i, β2i, β5i immunosubunits, PA28β, TAP1 and the MHC class I molecule as well as the proteasomal proteolytic activities were down-regulated in infected-IFN-γ-treated cell cultures. Taken together, our results provide evidence that the protozoan T. cruzi specifically modulates its infection through an unknown posttranscriptional mechanism that inhibits the expression of the MHC class I pathway components.
Conflict of interest statement
Figures
Similar articles
-
Abnormal IFN-gamma-dependent immunoproteasome modulation by Trypanosoma cruzi-infected macrophages.Parasite Immunol. 2008 May;30(5):280-92. doi: 10.1111/j.1365-3024.2008.01022.x. Epub 2008 Feb 25. Parasite Immunol. 2008. PMID: 18312504
-
The Combined Deficiency of Immunoproteasome Subunits Affects Both the Magnitude and Quality of Pathogen- and Genetic Vaccination-Induced CD8+ T Cell Responses to the Human Protozoan Parasite Trypanosoma cruzi.PLoS Pathog. 2016 Apr 29;12(4):e1005593. doi: 10.1371/journal.ppat.1005593. eCollection 2016 Apr. PLoS Pathog. 2016. PMID: 27128676 Free PMC article.
-
Trypanosoma cruzi: effect of the infection on the 20S proteasome in non-immune cells.Exp Parasitol. 2008 Nov;120(3):261-8. doi: 10.1016/j.exppara.2008.08.003. Epub 2008 Aug 26. Exp Parasitol. 2008. PMID: 18789322
-
Interferon-gamma inducible exchanges of 20S proteasome active site subunits: why?Biochimie. 2001 Mar-Apr;83(3-4):367-72. doi: 10.1016/s0300-9084(01)01251-2. Biochimie. 2001. PMID: 11295499 Review.
-
The immunoproteasome in antigen processing and other immunological functions.Curr Opin Immunol. 2013 Feb;25(1):74-80. doi: 10.1016/j.coi.2012.11.004. Epub 2012 Dec 6. Curr Opin Immunol. 2013. PMID: 23219269 Review.
Cited by
-
Host-parasite dynamics in Chagas disease from systemic to hyper-local scales.Parasite Immunol. 2021 Feb;43(2):e12786. doi: 10.1111/pim.12786. Epub 2020 Sep 24. Parasite Immunol. 2021. PMID: 32799361 Free PMC article. Review.
-
Exoproteome profiling of Trypanosoma cruzi during amastigogenesis early stages.PLoS One. 2019 Nov 22;14(11):e0225386. doi: 10.1371/journal.pone.0225386. eCollection 2019. PLoS One. 2019. PMID: 31756194 Free PMC article.
-
Dendritic Cells: A Double-Edged Sword in Immune Responses during Chagas Disease.Front Microbiol. 2016 Jul 14;7:1076. doi: 10.3389/fmicb.2016.01076. eCollection 2016. Front Microbiol. 2016. PMID: 27471496 Free PMC article. Review.
-
African Trypanosomiasis: Extracellular Vesicles Shed by Trypanosoma brucei brucei Manipulate Host Mononuclear Cells.Biomedicines. 2021 Aug 20;9(8):1056. doi: 10.3390/biomedicines9081056. Biomedicines. 2021. PMID: 34440259 Free PMC article.
-
Immunologic changes are detectable in the peripheral blood transcriptome of clinically asymptomatic Chagas cardiomyopathy patients.bioRxiv [Preprint]. 2023 Oct 5:2023.10.03.560680. doi: 10.1101/2023.10.03.560680. bioRxiv. 2023. PMID: 37873108 Free PMC article. Preprint.
References
-
- WHO – World Health Organization (2014) Fact Sheet N°340 – Chagas disease (American trypanosomiasis). Available: http://www.who.int/mediacentre/factsheets/fs340/en/index.html. Accessed 12 January 2014.
-
- Brener Z (1973) Biology of Trypanosoma cruzi . Annu Rev Microbiol 27: 347–382. - PubMed
-
- Burleigh BA, Andrews NW (1995) The mechanisms of Trypanosoma cruzi invasion of mammalian cells. Annu Rev Microbiol 49: 175–200. - PubMed
Publication types
MeSH terms
Substances
Grants and funding
LinkOut - more resources
Full Text Sources
Other Literature Sources
Medical
Research Materials
