. 2014:2014:326708.
doi: 10.1155/2014/326708. Epub 2014 Feb 11.

Anti-CD3 antibody treatment induces hypoglycemia and super tolerance to glucose challenge in mice through enhancing glucose consumption by activated lymphocytes

Affiliations

Anti-CD3 antibody treatment induces hypoglycemia and super tolerance to glucose challenge in mice through enhancing glucose consumption by activated lymphocytes

Chang-Qing Xia et al. J Immunol Res. 2014.

Abstract

Anti-CD3 antibody has been employed for various immune-mediated disorders. However, whether anti-CD3 administration leads to rapid metabolic alternation has not been well investigated. In the current study, we studied how anti-CD3 treatment affected blood glucose levels in mice. We found that anti-CD3 treatment induced immediate reduction of blood glucose after administration. Furthermore, a single dose of anti-CD3 treatment corrected hyperglycemia in all nonobese diabetic mice with recently diagnosed diabetes. This glucose-lowering effect was not attributable to major T cell produced cytokines. Of interest, when tested in a normal strain of mice (C57BL/6), the serum levels of C-peptide in anti-CD3 treated animals were significantly lower than control mice. Paradoxically, anti-CD3 treated animals were highly tolerant to exogenous glucose challenge. Additionally, we found that anti-CD3 treatment significantly induced activation of T and B cells in vitro and in vivo. Further studies demonstrated that anti-CD3 treatment lowered the glucose levels in T cell culture media and increased the intracellular transportation of 2-(N-(7-nitrobenz-2-oxa-1,3-diazol-4-yl)amino)-2 deoxyglucose (2-NBDG) particularly in activated T and B cells. In addition, injection of anti-CD3 antibodies induced enhanced levels of Glut1 expression in spleen cells. This study suggests that anti-CD3 therapy-induced hypoglycemia likely results from increased glucose transportation and consumption by the activated lymphocytes.


Figures
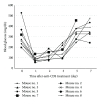
Figure 1
Figure 1
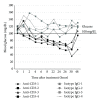
Effect of anti-CD3 treatment on blood glucose of NOD mice with new onset disease. NOD mice with blood glucose over 200 mg/dL for two consecutive days were treated with intraperitoneal injection of anti-CD3 (50 μg/mouse). Thereafter, blood glucose was monitored daily for 7 days. Eight diabetic NOD mice were included in this experiment.
Figure 2
Figure 2
Effect of anti-CD3 treatment on blood glucose of normal strain of mice. C57BL/6 mice were treated with intraperitoneal injection of anti-CD3 antibody (50 μg/mouse) or isotype IgG (50 μg/mouse). Four mice were included in each group. Blood glucose levels were measured at different time points as depicted in the figure. The blood glucose changes over 48 h observation were shown.
Figure 3
Figure 3
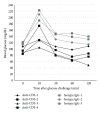
Intraperitoneal glucose tolerance test (IPGTT) in mice treated with anti-CD3 antibody or isotype IgG. C57BL/6 mice under the treatment of anti-CD3 antibody or isotype IgG as described elsewhere for 48 h received intraperitoneal injection of glucose (1 g/kg body weight). Thereafter, the blood glucose was monitored at 10, 30, 60, and 120 min. The glucose level before glucose injection served as the baseline level for each mouse. The results of all animals at different time points were depicted individually.
Figure 4
Figure 4
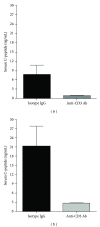
Serum C-peptide levels of the mice at 48 h after anti-CD3 or isotype IgG treatment and their levels after IPGTT. Serum samples were collected from the mice in Figure 3 before IPGTT and collected again after IPGTT. ELISA was used to measure C-peptide levels of all mice in both groups. Compared to controls, C-peptide levels of anti-CD3 treated mice were significantly lower before and after IPGTT (*P < 0.05).
Figure 5
Figure 5
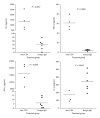
Serum cytokines in mice treated with anti-CD3 antibody or isotype IgG. C57BL/6 mice were treated with anti-CD3 (4 mice) or isotype IgG (6 mice). Six hours later, serum samples were collected for cytokine measurement. The cytokines, IFN-γ, TNF-α, IL-1, and IL-6, were examined by Luminex and the statistic analysis data were shown in the figure.
Figure 6
Figure 6
The influence of cytokines on blood glucose. (a) C57BL/6 mice were treated with intraperitoneal injection of a high dose of IFN-γ (200 ng/mouse) or PBS. Thereafter, the blood glucose level was monitored at different time points as shown in the figure; (b) C57BL/6 mice were treated with intraperitoneal injection of anti-CD3 antibody (50 μg/mouse) plus anti-IFN-γ antibody (50 μg/mouse), or anti-CD3 antibody (50 μg/mouse) plus isotype IgG (50 μg/mouse). Thereafter, the blood glucose level was monitored at different time points as shown in the figure; (c) C57BL/6 mice were treated with intraperitoneal injection of anti-CD3 antibody (50 μg/mouse) plus anti-IL-6 antibody (50 μg/mouse), or anti-CD3 antibody (50 μg/mouse) plus isotype IgG (50 μg/mouse). Thereafter, the blood glucose level was monitored at different time points as shown in the figure; (d) C57BL/6 mice were treated with intraperitoneal injection of anti-CD3 antibody (50 μg/mouse for 8 mice) or isotype IgG (50 μg/mouse for 4 mice). Anti-CD3 group was further divided into two subgroups with one group (4 mice) receiving anti-TNF-α (50 μg/mouse) and the other group (4 mice) receiving isotype IgG (50 μg/mouse) at 0 and 24 h time points. Additionally, two control mice without any treatment were included in this experiment. Thereafter, the blood glucose level was monitored at different time points as shown in the figure.
Figure 7
Figure 7
Effect of anti-CD3 treatment on blood glucose in NOD-Rag−/− mice. T cell deficient NOD-Rag−/− mice were treated with intraperitoneal injection of anti-CD3 antibody (50 μg/mouse for 3 mice) and isotype IgG (50 μg/mouse for 2 mice). Thereafter, the blood glucose level was monitored at different time points as shown in the figure.
Figure 8
Figure 8
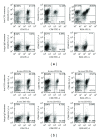
Effect of anti-CD3 antibody treatment on T and B cell activation in vitro and in vivo. (a) In vitro experiment. Spleen cells 1 × 10⁶/well in 24-well plate were stimulated with anti-CD3 antibodies (3 μg/mL) or Isotype IgG (3 μg/mL) for 24 hours. Thereafter, The cells were harvested and stained with CD4, CD8, B220, and CD69 and analyzed by flow cytometry. (b) In vivo experiment. C57BL/6 mice were treated with intraperitoneal injection of anti-CD3 antibodies (50 μg/mouse) or Isotype IgG (50 μg/mouse). Three mice were included in each group. Twenty-four hours later, all mice were killed, and spleen cells of each individual mouse were prepared and stained for CD4, CD8, B220, and CD69. The expression of these markers was examined by flow cytometry.
Figure 9
Figure 9
Anti-CD3 treatment enhances glucose intracellular transportation by the activated lymphocytes. (a) Freshly prepared spleen cells (1 × 10⁷/well) were cultured in a 24-well plate in 1 mL medium containing 10% fetal bovine serum with glucose concentration of 360 mg/dL. Anti-CD3 antibody (3 μg/mL) or isotype IgG (3 μg/mL) was added to the cultures. The culture wells were quadruplicated and incubated for 24 h. Glucose concentrations were measured before and 24 h after incubation. The results were reproduced in additional two independent experiments. (b) Freshly prepared spleen cells were stimulated with anti-CD3 antibody (3 μg/mL) or isotype IgG (3 μg/mL) for 3 hours; thereafter, different concentrations of 2-NBDG as indicated were added to the cultures for additional 2 hours. The fluorescent intensity of the cells was examined by BioTec plate reader using a laser filter with 480 nm excitation and 528 nm emission. The values of between anti-CD3 and isotype IgG were compared for each concentration of 2-NBDG (*P < 0.01). The similar results were reproduced in additional 3 independently experiments. (c) Spleen cells were stimulated with anti-CD3 antibodies as mentioned above for 3 hours, and then 100 μM of 2-NBDG was added to the cultures for additional 2 hours. Thereafter, the cells were harvested and stained with CD5-PerCp, B220-PE, and CD69-PE-Cy7. 2-NBDG+ cells in CD69− and CD69+ T cells and B cells were analyzed through gating CD5+ and B220+ cells, respectively. The percentages of 2-NBDG+CD69− and 2-NBDG+CD69+ T or B cells were compared, respectively (*P < 0.01). The data shown were obtained from a representative of three experiments. (d) B6 mice were treated with anti-CD3 (50 μg/mouse) or isotype IgG (50 μg/mouse). Three mice were included in each group. Six hours later, the spleen cells were prepared and Glut1 expression was examined by real-time PCR. The values were normalized by housekeeping gene β actin, and the expression of Glut1 for isotype IgG treated mice was defined as 1. Data shown were obtained from 3 mice in each group.

Similar articles

Cited by

References

    1. Yu X-Z, Levin SD, Madrenas J, Anasetti C. Lck is required for activation-induced T cell death after TCR ligation with partial agonists. Journal of Immunology. 2004;172(3):1437–1443. - PubMed
    1. Fife BT, Guleria I, Bupp MG, et al. Insulin-induced remission in new-onset NOD mice is maintained by the PD-1-PD-L1 pathway. The Journal of Experimental Medicine. 2006;203(12):2737–2747. - PMC - PubMed
    1. Penaranda C, Tang Q, Bluestone JA. Anti-CD3 therapy promotes tolerance by selectively depleting pathogenic cells while preserving regulatory T cells. Journal of Immunology. 2011;187(4):2015–2022. - PMC - PubMed
    1. You S, Leforban B, Garcia C, Bach J-F, Bluestone JA, Chatenoud L. Adaptive TGF-β-dependent regulatory T cells control autoimmune diabetes and are a privileged target of anti-CD3 antibody treatment. Proceedings of the National Academy of Sciences of the United States of America. 2007;104(15):6335–6340. - PMC - PubMed
    1. Bresson D, Togher L, Rodrigo E, et al. Anti-CD3 and nasal proinsulin combination therapy enhances remission from recentonset autoimmune diabetes by inducing Tregs. The Journal of Clinical Investigation. 2006;116(5):1371–1381. - PMC - PubMed

Publication types

MeSH terms