. 2014 Jul;88(13):7389-401.
doi: 10.1128/JVI.00845-14. Epub 2014 Apr 16.

CTCF binding to the first intron of the major immediate early (MIE) gene of human cytomegalovirus (HCMV) negatively regulates MIE gene expression and HCMV replication

Affiliations

CTCF binding to the first intron of the major immediate early (MIE) gene of human cytomegalovirus (HCMV) negatively regulates MIE gene expression and HCMV replication

Francisco Puerta Martínez et al. J Virol. 2014 Jul.

Abstract

Human cytomegalovirus (HCMV) gene expression during infection is highly regulated, with sequential expression of immediate-early (IE), early (E), and late (L) gene transcripts. To explore the potential role of chromatin regulatory factors that may regulate HCMV gene expression and DNA replication, we investigated the interaction of HCMV with the cellular chromatin-organizing factor CTCF. Here, we show that HCMV-infected cells produce higher levels of CTCF mRNA and protein at early stages of infection. We also show that CTCF depletion by short hairpin RNA results in an increase in major IE (MIE) and E gene expression and an about 50-fold increase in HCMV particle production. We identified a DNA sequence (TTAACGGTGGAGGGCAGTGT) in the first intron (intron A) of the MIE gene that interacts directly with CTCF. Deletion of this CTCF-binding site led to an increase in MIE gene expression in both transient-transfection and infection assays. Deletion of the CTCF-binding site in the HCMV bacterial artificial chromosome plasmid genome resulted in an about 10-fold increase in the rate of viral replication relative to either wild-type or revertant HCMV. The CTCF-binding site deletion had no detectable effect on MIE gene-splicing regulation, nor did CTCF knockdown or overexpression of CTCF alter the ratio of IE1 to IE2. Therefore, CTCF binds to DNA within the MIE gene at the position of the first intron to affect RNA polymerase II function during the early stages of viral transcription. Finally, the CTCF-binding sequence in CMV is evolutionarily conserved, as a similar sequence in murine CMV (MCMV) intron A was found to interact with CTCF and similarly function in the repression of MCMV MIE gene expression mediated by CTCF.

Importance: Our findings that CTCF binds to intron A of the cytomegalovirus (CMV) major immediate-early (MIE) gene and functions to repress MIE gene expression and viral replication are highly significant. For the first time, a chromatin-organizing factor, CTCF, has been found to facilitate human CMV gene expression, which affects viral replication. We also identified a CTCF-binding motif in the first intron (also called intron A) that directly binds to CTCF and is required for CTCF to repress MIE gene expression. Finally, we show that the CTCF-binding motif is conserved in CMV because a similar DNA sequence was found in murine CMV (MCMV) that is required for CTCF to bind to MCMV MIE gene to repress MCMV MIE gene expression.


Figures

FIG 1
FIG 1
HCMV induces CTCF production at an early time of infection. MRC-5 cells were infected with HCMV at an MOI of 0.5 for different times, as indicated. (A) Whole-cell lysates were collected and subjected to SDS-PAGE to examine cellular and viral protein production by Western blot assay with antibodies against viral proteins (IE1/IE2) and CTCF. Tubulin was used as a sample-loading control. The fold increases in CTCF levels relative to mock-treated and tubulin controls were calculated by Quantity One 4.5.0 software (Bio-Rad Laboratories, Richmond, CA). Quantification of CTCF levels (means ± standard deviations) is shown at the bottom as bar graphs generated from at least three independent viral infections and Western blot assays. (B) Total RNA was isolated from mock-infected (0 hpi) or HCMV-infected cells, and 1 μg of the resulting sample was analyzed by quantitative RT-PCR. CTCF mRNA levels at different time points after HCMV infection relative to the level at 0 hpi are shown. The bar graph represents the mean ± standard deviation from three independent experiments. Statistically significant differences were calculated by Student's t test and are indicated at the top (P < 0.005).
FIG 2
FIG 2
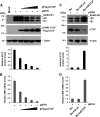
Effects of CTCF protein levels on MIE gene expression. (A) 293T cells were used for the cotransfection of 1 μg of pSVH (expressing IE1/IE2 under MIEP control) together with different amounts (0.5, 1, 2, and 3 μg) of pFlag-CTCF or the vector control (by using 3 μg of pcDNA3 to supplement the total DNA in the cotransfection system). Whole-cell lysate samples were used for Western blot assays to examine the production of IE1, IE2, and CTCF. Tubulin was used as a sample-loading control. The fold variations in IE1/2 levels relative to pSVH and the vector control were quantified by Quantity One 4.5.0 software and are shown at the bottom as bar graphs (means ± standard deviations) generated from three independent experiments. (B) Same as panel A, except that total RNA samples (1 μg for each assay) were used for real-time RT-PCR to examine IE1 mRNA. The bar graph shows the average value of the IE1 mRNA level of pSVH with pFlag-CTCF relative to that of pSVH alone from three independent experiments (means ± standard deviations). (C) Western blot assays performed to examine CTCF depletion and IE1/IE2 production after the transfection of pSVH into BJ cells or BJ cells stably expressing shRNA against CTCF or control luciferase (Luc). Tubulin was used to control the sample loading. The fold increases in IE1/2 levels relative to BJ cells alone were calculated by Quantity One 4.5.0 software and are shown as bar graphs below the corresponding Western blot assays. (D) Same as panel C, except that real-time RT-PCR was used to examine IE1 mRNA levels in stable knockdown cell lines transfected with pSVH. The levels of IE1 mRNA in different cells were compared to that in control BJ cells. The bar graph represents the means ± standard deviations of three independent experiments.
FIG 3
FIG 3
CTCF interacts directly with intron A. (A) The DNA sequences of the HCMV MIE gene, from the TATA box to the beginning of exon 2, are shown. The NF-1 and CTCF BSs are underlined. Total exon 1 and partial exon 2 sequences are shown in the enclosing boxes. (B) An FP assay was used to determine whether the DNA fragment was bound by CTCF. Kis were calculated by titrating the HCMV CTCF BS probe against a FAM-labeled probe with a known dissociation constant and measuring changes in CTCF binding via FP assay. The graph represents the mean ± standard deviation of three independent experiments. mP, millipolarization units. (C) An EMSA was used to determine CTCF binding to DNA oligonucleotide probes containing putative BSs from HCMV intron A (HCMV CTCF BS) or XqYq subtelomeres (XqYq CTCF BS), as well as oligonucleotides containing CTCF BS deletion (HCMV ΔCTCF) or point mutations in CTCF recognition sites (XqYq ΔCTCF). The positions of the free probe and the bound probe are indicated on the left. (D) ChIP assay with HEK 293T cells transfected with pSVH at 24 h posttransfection with antibodies specific to CTCF or control IgG. qPCR was used to quantify ChIP efficiency with specific primers in the regions indicated. The bar graph represents the mean percentage of the input for each ChIP from three independent PCRs ± the standard deviation.
FIG 4
FIG 4
The CTCF-binding domain in intron A is essential for CTCF-mediated inhibition of MIE gene expression. (A) 293T cells were transfected with pSVH-dCTCFi and different amounts of pFlag-CTCF (0, 0.5, 1, 2, and 4 μg) and assayed for IE1/IE2 expression by Western blotting at 24 h posttransfection. The overexpressed CTCF level was examined by using anti-Flag antibody. Tubulin was used as a sample-loading control. The relative IE1/2 levels calculated by Quantity One 4.5.0 software as described in the legend to Fig. 2A are shown as bar graphs below the corresponding Western blot assays. (B) Same as panel A, except that total RNA samples (1 μg for each assay) were used for real-time RT-PCR in order to detect IE1 mRNA. The bar graph shows the mean IE1 mRNA level of pSVH with pFlag-CTCF relative to that of pSVH alone from three independent experiments ± the standard deviation. (C) 293T cells were cotransfected with pSVH and various amounts (0.5, 1, 2, and 4 μg) of pFlag-Rad21 for 24 h. Whole-cell lysates were assayed by Western blotting with antibodies against IE1/IE2 to detect MIE gene expression, with antibodies against Flag to examine Rad21 overexpression and with antibodies against tubulin as a loading control. The quantification of IE1/2 levels relative to pSVH and the tubulin control is shown as bar graphs below the corresponding Western blot assays. (D) Same as panel C, except that the real-time RT-PCR was performed to detect IE1 mRNA. The bar graph shows the mean IE1 mRNA level of pSVH with pFlag-Rad21 relative to that of pSVH alone from three independent experiments ± the standard deviation. (E) Western blot analysis of 293T cells transfected with pSVH alone, pSVH with pRad21, pSVH with pCTCF, or pSVH with pRad21 and pCTCF with the antibodies indicated. The quantification of IE1/2 levels relative to pSVH alone and the tubulin control is shown as bar graphs below the corresponding Western blot assays. (F) Same as panel E, except that the quantitative RT-PCR was performed to examine MIE gene expression. The bar graph shows the mean IE1 mRNA level relative to that of pSVH alone from three independent experiments ± the standard deviation. Student's t test was used to statistically compare two groups as indicated at the top of the bar graph (*, P < 0.005; **, P > 0.1).
FIG 5
FIG 5
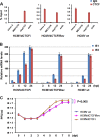
Deletion of the CTCF motif from intron A led to increases in HCMV IE gene expression and viral DNA replication. (A) ChIP-qPCR analysis of CTCF or control IgG with primers specific for the regions indicated in MRC-5 cells infected with HCMVwt, HCMVdCTCFiRev, or HCMVdCTCFi at an MOI of 0.5 for 12 h. The bar graph represents the mean percentage of the input in each ChIP from three independent PCRs ± the standard deviation. (B) Quantitative RT-PCR analysis of IE1 and IE2 mRNAs in MRC-5 cells infected with HCMVs at an MOI of 0.1 at the indicated times after infection. The bar graph represents the relative RT-PCR values from three independent experiments (means ± standard deviations). (C) MRC-5 cells were infected with the HCMVs indicated at an MOI of 0.05, and the viral growth curve was determined by using PFU assays at the indicated times after infection. Student's t test was used to statistically analyze the difference between HCMVdCTCFi infection and HCMVwt (P < 0.005) and HCMVdCTCFiRev (P < 0.005) infections.
FIG 6
FIG 6
Depletion of CTCF protein enhances HCMV gene expression and viral replication. (A) Quantitative RT-PCR analysis of IE1, IE2, and UL112/113 mRNAs in BJ-kdLuc or BJ-kdCTCF cells infected with HCMVwt (left panel), HSMVdCTCFiRev (middle panel), or HCMVdCTCFi (right panel) at an MOI of 0.1 at the indicated times after infection. The bar graph represents the relative RT-PCR values from three independent experiments (means ± standard deviations). (B) BJ-kdCTCF or BJ-kdLuc cells were infected with the indicated HCMVs at an MOI of 0.05, and the viral growth curve was determined by using PFU assays at the indicated times after infection. Student's t test was used to statistically analyze the difference in viral production between BJ-kdCTCF and BJ-kdLuc cells at the time points indicated (*, P < 0.005; **, P < 0.05).
FIG 7
FIG 7
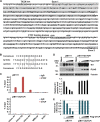
The CTCF-binding domain in intron A is conserved in HCMV and MCMV. (A) DNA sequences of the MCMV MIE genes, from the TATA box to the beginning of exon 2. The CTCF BS is underlined. Exon 1 sequences are boxed. (B) Homologous comparison of the CTCF-binding sequence from HCMV and MCMV to the consensus sequence of the canonical CTCF-binding motif. (C) ChIP-qPCR analysis of CTCF or control IgG with primers specific for the indicated regions in 293T cells transfected with either pIE111 (a plasmid expressing the MCMV MIE gene under the control of the MIEP) (top) or pIE111dCTCFi (derived from pIE111 but with the CTCF BS deleted) (bottom) at 24 h posttransfection. (D) Western blotting was used to determine MCMV IE1 expression in 293T cells cotransfected with various amount of pFlag-CTCF (0.5, 1, and 2 μg) and either pIE111 (left) or pIE111dCTCFi (right) at 24 h posttransfection. Flag antibody was used to determine CTCF expression, and tubulin served as a sample-loading control. Quantification of IE1 levels was done by Quantity One 4.5.0 software, and normalized IE1 levels are shown as bar graphs below the corresponding Western blot assays. (E) Same as panel D, except that quantitative RT-PCR was used to determine IE1 mRNA levels. The bar graph represents the relative RT-PCR values (means ± standard deviations) from three independent experiments.

Similar articles

Cited by

References

    1. Landolfo S, Gariglio M, Gribaudo G, Lembo D. 2003. The human cytomegalovirus. Pharmacol. Ther. 98:269–297. 10.1016/S0163-7258(03)00034-2 - DOI - PubMed
    1. Mocarski ES, Jr, Shenk T, Pass RF. 2006. Cytomegaloviruses, 5th ed. Lippincott Williams &Wilkins, Philadelphia, PA
    1. Sweet C. 1999. The pathogenicity of cytomegalovirus. FEMS Microbiol. Rev. 23:457–482. 10.1111/j.1574-6976.1999.tb00408.x - DOI - PubMed
    1. Ahn JH, Hayward GS. 1997. The major immediate-early proteins IE1 and IE2 of human cytomegalovirus colocalize with and disrupt PML-associated nuclear bodies at very early times in infected permissive cells. J. Virol. 71:4599–4613 - PMC - PubMed
    1. Awasthi S, Isler JA, Alwine JC. 2004. Analysis of splice variants of the immediate-early 1 region of human cytomegalovirus. J. Virol. 78:8191–8200. 10.1128/JVI.78.15.8191-8200.2004 - DOI - PMC - PubMed

Publication types

MeSH terms