. 2014 Apr 16;9(4):e94035.
doi: 10.1371/journal.pone.0094035. eCollection 2014.

Dynamic localization of glucokinase and its regulatory protein in hypothalamic tanycytes

Affiliations

Dynamic localization of glucokinase and its regulatory protein in hypothalamic tanycytes

Magdiel Salgado et al. PLoS One. .

Abstract

Glucokinase (GK), the hexokinase involved in glucose sensing in pancreatic β cells, is also expressed in hypothalamic tanycytes, which cover the ventricular walls of the basal hypothalamus and are implicated in an indirect control of neuronal activity by glucose. Previously, we demonstrated that GK was preferentially localized in tanycyte nuclei in euglycemic rats, which has been reported in hepatocytes and is suggestive of the presence of the GK regulatory protein, GKRP. In the present study, GK intracellular localization in hypothalamic and hepatic tissues of the same rats under several glycemic conditions was compared using confocal microscopy and Western blot analysis. In the hypothalamus, increased GK nuclear localization was observed in hyperglycemic conditions; however, it was primarily localized in the cytoplasm in hepatic tissue under the same conditions. Both GK and GKRP were next cloned from primary cultures of tanycytes. Expression of GK by Escherichia coli revealed a functional cooperative protein with a S0.5 of 10 mM. GKRP, expressed in Saccharomyces cerevisiae, inhibited GK activity in vitro with a Ki 0.2 µM. We also demonstrated increased nuclear reactivity of both GK and GKRP in response to high glucose concentrations in tanycyte cultures. These data were confirmed using Western blot analysis of nuclear extracts. Results indicate that GK undergoes short-term regulation by nuclear compartmentalization. Thus, in tanycytes, GK can act as a molecular switch to arrest cellular responses to increased glucose.


Conflict of interest statement

Competing Interests: The authors have declared that no competing interests exist.

Figures

Figure 1
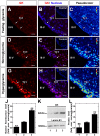
Figure 1. Immunolocalization and Western blot analysis of hypothalamic GK.
A-I, Frontal sections of rat hypothalamus were obtained from animals exposed to different glycemic conditions and were immunostained with rabbit anti-GK (1∶100). Fasting (A–C), normoglycemia (D–F) and hyperglycemia (G–I). C, F and I, semi-quantitative analysis of GK immunofluorescence by pseudocolor (blue, negative signal; yellow, medium signal; red, high signal). Inserts in B, E and H correspond to the immunoreaction using anti-GK preabsorbed with inductor peptides. J, Quantitative analysis of nuclear intensity of tanycyte GK in different glycemic conditions. Statistical analysis was performed using the one way ANOVA-Dunnet test; P-values<0.05 were considered significant. Data represent the average fluorescence intensity of GK-positive nuclei in a total of 200 tanycytes obtained from five animals per condition. K, Immunoblots of GK (52 kDa, upper-panel) and lamin-B1 (68 kDa, lower panel) in nuclear protein extracts obtained in different glycemic conditions. L, Quantitative analysis of GK nuclear expression relative to lamin-B1. The nuclear localization of GK increased gradually in response to glycemia. Statistical analysis was performed using the one way ANOVA-Dunnet test; P-values<0.05 were considered significant. J-L, 1-3 represent fasting, normoglycemic and hyperglycemic conditions, respectively. Data represent the means±SD from six independent determinations. III-V: third ventricle; Tβ1: β1 tanycytes. Scale bars, 25 µm.
Figure 2
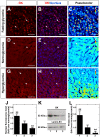
Figure 2. Immunolocalization and Western blot analysis of liver GK.
A-I, Sections of liver were obtained from animals exposed to different glycemic conditions and were immunostained with rabbit anti-GK (1∶100). Hypoglycemia (A–C), normoglycemia (D–F) and hyperglycemia (G–I). C, F and I, semi-quantitative analysis of GK immunofluorescence by pseudocolor (blue, negative signal; yellow, medium signal; red, high signal). J, Quantitative analysis of nuclear intensity of hepatocyte GK at different glycemic conditions. Statistical analysis was performed using the one way ANOVA-Dunnet test; P-values<0.05 were considered significant. Data represent the average fluorescence intensity of GK-positive nuclei in a total of 200 hepatocytes. K, Immunoblots of GK (52 kDa, upper-panel) and lamin-B1 (68 kDa, lower panel) in nuclear protein extracts obtained in different glycemic conditions. L, Quantitative analysis of GK nuclear expression relative to lamin-B1. The nuclear localization of GK decreased gradually in response to glycemia. Statistical analysis was performed using the one way ANOVA-Dunnet test; P-values<0.05 were considered significant. J-L, 1-3 represent fasting, normoglycemic and hyperglycemic conditions, respectively. Data represent the means±SD from six independent determinations. Scale bars, 100 µm.
Figure 3
Figure 3. Identification of GK and GKRP isoforms expressed in tanycytes.
A, GK sequences were amplified by RT-PCR using primers that were specific for pancreatic GK (856 bp; top panel), liver GK (388 bp; middle panel), and β-actin (353 bp; bottom panel). PCR products amplified from liver (lane 1), pancreas (lane 2), hypothalamus (lane 3), tanycytes in culture (lane 4) cDNA. Negative controls consisted of RT(-) of hypothalamus (lane 5) and tanycytes (lane 6). B, Immunoblots of GK in total protein extract from pancreas (lane 1), hypothalamus (lane 2) and tanycyte cultures (lane 3), negative control using pre-absorbed antibody (lane 4). C, RT-PCR to amplify GKRP (418 pb; upper-panel) and β-actin (353 bp; lower-panel) using liver (lane 1), hypothalamus (lane 2), tanycytes (lane 3) and pancreas (lane 4) cDNA. Negative controls consisted of RT(-) of hypothalamus (lane 5) and tanycytes (lane 6) cDNA. D, Immunoblots of GKRP in total protein extract from liver (lane 1), hypothalamus (lane 2) and tanycyte culture (lane 3), using the omission of anti-GKRP (lanes 4).
Figure 4
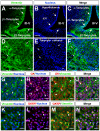
Figure 4. Hypothalamic tanycytes expressed GK and GKRP.
A–F, Confocal microscopy analysis of immunofluorescence using anti-vimentin (green) and Topro-3 nuclear stain (blue). A–C, 40-μm slides of frontal rat hypothalamus showing vimentin expression in α and β-tanycytes. D–F, Tanycyte primary cultures, which maintain their polarization and vimentin expression. G–J, Immunodetection of GK in tanycytes cultured in 5. 5 mM glucose. K–N, Immunodetection of GKRP in tanycytes cultured in 5.5 mM glucose.
Figure 5
Figure 5. Kinetic characterization of GK and its inhibition by GKRP.
A, Using a glucose-6-phosphate dehydrogenase-coupled method, we evaluated the concentration dependence of glucose phosphorylation by recombinant GK with 1 mM ATP and pH 7.5. B, Hill plot analysis of the data shown in A, displaying a positive cooperativity with a S0.5 of 10 mM and a 1.5 nH. C, Inhibitory effect of GKRP (0.05–0.25 µM) over GK activity. As has been reported in hepatocytes, GKRP inhibits glial GK in a dose-dependent manner, resulting in a median inhibitory concentration (IC50) of 0.28 mM. D, Effect of GKRP in GK saturation by glucose displaying a decrease in the maximal velocity of the reaction with 0.1 and 0.2 µM GKRP. E, Due to the cooperative behavior of GK, we performed a Segel-proposed plot of the data from D to determine the inhibition constant (Ki) of GKRP upon GK. Results represent the mean±SD of three independent experiments.
Figure 6
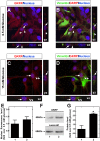
Figure 6. Dynamic localization of GK in cultured tanycytes in response to glucose.
A–D. GK immunolocalization (red) in tanycytes preincubated with 0.5 mM glucose for 6 h (A–B) or incubated with 15 mM glucose for 30 min (C–D). Nuclei (A–C) and Vimentin (B, D) are stained in blue and green, respectively. Arrows and arrowheads show nuclear and cytoplasmic GK localization, respectively. Images were obtained by Z-stack reconstruction, and white lines indicate orthogonal planes (XZ and YZ) shown in the lateral and lower panels. E, Nuclear intensity of GK immunofluorescence in tanycytes cultured in the presence of 0.5 mM (lane 1) and 15 mM (lane 2) glucose. The results represent the mean±sd of 200 cells from three independent primary cultures. F, Immunoblots of GK (52 kDa, upper panel) and the nuclear marker, lamin-B1 (68 kDa, lower panel), in nuclear extracts obtained from cells cultured with 0.5 mM (lane 1) and 15 mM (lane 2) glucose. G, GK nuclear expression levels assessed by western-blot were quantified and normalized with lamin-B for cells cultured with 0.5 mM (lane 1) and 15 mM (lane 2) glucose. The data shows the means±SD from six independent experiments. * p<0.05; ** p<0.01. Scale bar in A–D, 50 µm.
Figure 7
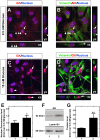
Figure 7. Dynamic localization of GKRP in cultured tanycytes in response to glucose.
AD. GKRP immunolocalization (red) in tanycytes preincubated with 0.5 mM glucose for 6 h (A–B) or incubated with 15 mM glucose for 30 min (C–D). Nuclei (A–C) and Vimentin (B, D) are stained in blue and green, respectively. Arrows and arrowheads show nuclear and cytoplasmic GKRP localization, respectively. Images were obtained by Z-stack reconstruction, and white lines indicate orthogonal planes (XZ and YZ) shown in the lateral and lower panels. E, Nuclear intensity of GKRP immunofluorescence in tanycytes cultured in the presence of 0.5 mM (lane 1) and 15 mM (lane 2) glucose. The results represent the mean±sd of 200 cells from three independent primary cultures. F, Immunoblots of GKRP (69 kDa, upper panel) and the nuclear marker, lamin-B1 (68 kDa, lower panel), in nuclear extracts obtained from cells cultured with 0.5 mM (lane 1) and 15 mM (lane 2) glucose. G, GKRP nuclear expression levels assessed by western-blot were quantified and normalized with lamin-B for cells cultured with 0.5 mM (lane 1) and 15 mM (lane 2) glucose. The data shows the means±SD from six independent experiments. * p<0.05; ** p<0.01. Scale bar in A-D, 50 µm.

Similar articles

Cited by

  • Nutrient Sensing by Hypothalamic Tanycytes.
    Elizondo-Vega RJ, Recabal A, Oyarce K. Elizondo-Vega RJ, et al. Front Endocrinol (Lausanne). 2019 Apr 16;10:244. doi: 10.3389/fendo.2019.00244. eCollection 2019. Front Endocrinol (Lausanne). 2019. PMID: 31040827 Free PMC article. Review.
  • Insights into the role of neuronal glucokinase.
    De Backer I, Hussain SS, Bloom SR, Gardiner JV. De Backer I, et al. Am J Physiol Endocrinol Metab. 2016 Jul 1;311(1):E42-55. doi: 10.1152/ajpendo.00034.2016. Epub 2016 May 17. Am J Physiol Endocrinol Metab. 2016. PMID: 27189932 Free PMC article. Review.
  • Connexin-43 Gap Junctions Are Responsible for the Hypothalamic Tanycyte-Coupled Network.
    Recabal A, Elizondo-Vega R, Philippot C, Salgado M, López S, Palma A, Tarifeño-Saldivia E, Timmermann A, Seifert G, Caprile T, Steinhäuser C, García-Robles MA. Recabal A, et al. Front Cell Neurosci. 2018 Nov 26;12:406. doi: 10.3389/fncel.2018.00406. eCollection 2018. Front Cell Neurosci. 2018. PMID: 30534054 Free PMC article.
  • Lactate activates hypothalamic POMC neurons by intercellular signaling.
    Órdenes P, Villar PS, Tarifeño-Saldivia E, Salgado M, Elizondo-Vega R, Araneda RC, García-Robles MA. Órdenes P, et al. Sci Rep. 2021 Nov 4;11(1):21644. doi: 10.1038/s41598-021-00947-7. Sci Rep. 2021. PMID: 34737351 Free PMC article.
  • The role of tanycytes in hypothalamic glucosensing.
    Elizondo-Vega R, Cortes-Campos C, Barahona MJ, Oyarce KA, Carril CA, García-Robles MA. Elizondo-Vega R, et al. J Cell Mol Med. 2015 Jul;19(7):1471-82. doi: 10.1111/jcmm.12590. Epub 2015 Jun 17. J Cell Mol Med. 2015. PMID: 26081217 Free PMC article. Review.

References

    1. Schwartz MW, Woods SC, Porte D Jr, Seeley RJ, Baskin DG (2000) Central nervous system control of food intake. Nature 404: 661–671. - PubMed
    1. Song Z, Routh VH (2005) Differential effects of glucose and lactate on glucosensing neurons in the ventromedial hypothalamic nucleus. Diabetes 54: 15–22. - PubMed
    1. Yang XJ, Kow LM, Funabashi T, Mobbs CV (1999) Hypothalamic glucose sensor: similarities to and differences from pancreatic beta-cell mechanisms. Diabetes 48: 1763–1772. - PubMed
    1. Chauvet N, Parmentier ML, Alonso G (1995) Transected axons of adult hypothalamo-neurohypophysial neurons regenerate along tanycytic processes. J Neurosci Res 41: 129–144. - PubMed
    1. Flament-Durand J, Brion JP (1985) Tanycytes: morphology and functions: a review. Int Rev Cytol 96: 121–155. - PubMed

Publication types

Grants and funding

This work was supported by FONDECYT grant 1100705(to MAG). The funders had no role in study design, data collection and analysis, decision to publish, or preparation of the manuscript.