. 2014 May 22;509(7501):492-6.
doi: 10.1038/nature13180. Epub 2014 Apr 9.

Copper is required for oncogenic BRAF signalling and tumorigenesis

Affiliations

Copper is required for oncogenic BRAF signalling and tumorigenesis

Donita C Brady et al. Nature. .

Abstract

The BRAF kinase is mutated, typically Val 600→Glu (V600E), to induce an active oncogenic state in a large fraction of melanomas, thyroid cancers, hairy cell leukaemias and, to a smaller extent, a wide spectrum of other cancers. BRAF(V600E) phosphorylates and activates the MEK1 and MEK2 kinases, which in turn phosphorylate and activate the ERK1 and ERK2 kinases, stimulating the mitogen-activated protein kinase (MAPK) pathway to promote cancer. Targeting MEK1/2 is proving to be an important therapeutic strategy, given that a MEK1/2 inhibitor provides a survival advantage in metastatic melanoma, an effect that is increased when administered together with a BRAF(V600E) inhibitor. We previously found that copper (Cu) influx enhances MEK1 phosphorylation of ERK1/2 through a Cu-MEK1 interaction. Here we show decreasing the levels of CTR1 (Cu transporter 1), or mutations in MEK1 that disrupt Cu binding, decreased BRAF(V600E)-driven signalling and tumorigenesis in mice and human cell settings. Conversely, a MEK1-MEK5 chimaera that phosphorylated ERK1/2 independently of Cu or an active ERK2 restored the tumour growth of murine cells lacking Ctr1. Cu chelators used in the treatment of Wilson disease decreased tumour growth of human or murine cells transformed by BRAF(V600E) or engineered to be resistant to BRAF inhibition. Taken together, these results suggest that Cu-chelation therapy could be repurposed to treat cancers containing the BRAF(V600E) mutation.


Conflict of interest statement

Competing financial interest A provisional patent application (D.C.B., M.L.T., D.J.T., and C.M.C.) has been filed regarding the use of Cu chelators for the treatment of BRAF and RAS mutation-positive cancers.

The authors declare no competing financial interests.

Figures

Extended Data Figure 1
Extended Data Figure 1. CuSO4 stimulates MEK1/2 kinase activity in vitro
Detection of the amount of in vitro phosphorylated (P) recombinant GST-tagged kinase-inactive ERK2K54R protein by a, recombinant GST-tagged MEK1 in the presence, when indicated, of 2.5 molar equivalents of CuSO4 (Cu), AgNO3 (Ag), FeNH2SO4 (Fe), NiSO4 (Ni) or ZnSO4 (Zn) or c, recombinant GST-tagged MEK2 in the presence, when indicated, of 2.5 μM CuSO4 and/or 50 μM TTM. Total (T) levels of ERK2, MEK1 and MEK2 serve as loading controls. b, Immunoblot detection of the amount of recombinant GST-tagged MEK2 protein bound to a resin charged with (Cu) or without (-) Cu. Input serves as a loading control. Gel images are representative of two replicates.
Extended Data Figure 2
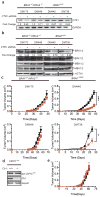
Extended Data Figure 2. Genetic ablation of Ctr1 decreases BRAFV600E-mediated cell growth and tumorigenesis
a, Cell growth, as measured by crystal violet staining, of BRAFV600E-transformed, immortalized Ctr1+/+ (black circle) or Ctr1-/- (red square) MEFs (plated in sextuplicate) over a period of three days. Representative of three experiments. b, Representative resected tumors (scale bar = 1 cm) at 20 days post injection and c, Kaplan-Meier analysis of percentage of mice with tumor volume ≥ 1.0 cm3 versus time (days) of mice (n=8) injected with BRAFV600E-transformed, immortalized Ctr1+/+ (black line) or Ctr1-/- (red line) MEFs. ****P<0.0001.
Extended Data Figure 3
Extended Data Figure 3. Identification of Cu-binding mutants of MEK1 that reduce ERK1/2 phosphorylation
a, Immunoblot detection of the amount of HA-tagged wild-type (WT) MEK1 and an example of one MEK1 mutant tested (H188A) that bound to a Cu-charged resin. Input serves as a loading control. b, Immunoblot detection of the amount of phosphorylated (P) and/or total (T) ERK1/2 or HA-MEK1 protein in immortalized Ctr1+/+ MEFs stably expressing HA-tagged wild-type (WT) MEK1 or an example of one MEK1 mutant tested (H188A). c, Summary of whether the indicated MEK1 point mutants did (YES) or did not (NO) exhibit a reduction in binding to the Cu-charged resin or show a reduction in the levels of phosphorylated (P) ERK1/2 when stably expressed in immortalized Ctr1+/+ MEFs. Gel images are representative of two replicates.
Extended Data Figure 4
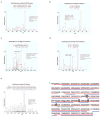
Extended Data Figure 4. Amino acids in MEK1 identified to be oxidized by the MCO reaction followed by MS/MS
Representative annotated MS/MS fragmentation spectra for five indicated MEK1-derived peptides containing oxidized residues a, MEK1H87 and MEK1M94 b, MEK1H100 c,MEK1H188 d, MEK1M230 and e, MEK1H239 highlighted in red. The peak heights are the relative abundances of the corresponding fragmentation ions, with the annotation of the identified matched amino terminus-containing ions (b ions) in blue and the carboxyl terminus-containing ions (y ions) in red. For clarity, only the major identified peaks are labeled. f, Amino acid sequence of human MEK1 with the peptides identified by MS/MS underlined (red: trypsin digest and blue: chymotrypsin digest). Amino acids oxidized only in the presence of H2O2 in one to three independent MCO reactions are denoted in red. Amino acids, that when mutated to alanine reduced both binding of MEK1 to a Cu-charged resin and phosphorylation of cellular ERK2, are boxed (from Extended Data Fig. 3c).
Extended Data Figure 5
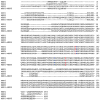
Extended Data Figure 5. Alignment of the amino acid sequence of MEK1, MEK2, MEK5, and MEK1-MEK5
The amino acid sequence of human MEK1, MEK2, MEK5, and the MEK1-MEK5 chimeric protein (without the DD mutation) aligned using Clustal W. Black letters: amino acids. Colored letters: the four amino acids mutated in MEK1CBM to reduce Cu-binding (blue: conserved between MEK1, MEK2 and MEK5, red: conserved only between MEK1 and MEK2). Dashes (-): gaps in the alignment.
Extended Data Figure 6
Extended Data Figure 6. Protein purification and biochemical analysis of wild-type and CBM versions of MEK1
a, Coomassie Brilliant Blue detection of the amount of wild-type (WT) or CBM mutant (CBM) purified recombinant GST-tagged MEK1 protein in the absence or presence of precision protease for cleavage of GST. b, Circular dichroism spectra at increasing wavelengths (nm) c, thermal denaturation monitored at 222 nm at increasing temperature (°C) and d, differential scanning fluorimetry at increasing temperature (°C, left) and the average estimated melting temperature (right) of purified recombinant MEK1WT (black cirlce, line,) and MEK1CBM (red square, line). Data are representative of two replicates.
Extended Data Figure 7
Extended Data Figure 7. Tumorigenic growth of NRAS mutation-positive human melanoma cancer cell lines upon knockdown of CTR1
a, RT-PCR detection of the amount of endogenous CTR1 and GAPDH mRNA and b, mean tumor volume (cm3) ± s.e.m. versus time (days) in mice (n=3) injected with the NRAS mutation-positive (NRASQ61L) human melanoma cell lines DM598 and DM792 stably infected with a retrovirus expressing either a scramble (SCRAM) shRNA (black circle) or CTR1 shRNA (red square). ****P<0.0001.
Extended Data Figure 8
Extended Data Figure 8. Detection of Cre-mediated recombination and weight measurements of AdCre-treated Ctr1+/+ versus Ctr1flox/flox BP mice
a, PCR detection of BRafCA/+,Trp53flox/flox, and Ctr1flox/flox recombinated alleles from matched tail samples (T) and lung tumor cell lines (C) generated from indicated genotypes. Alleles are indicated by: WT (black), flox (red), null (blue), BrafCA (orange) or BrafV600E (green) arrowheads. b, Box and whiskers plot of weight (grams) of Ctr1+/+ versus Ctr1flox/flox BP mice (n=30) one month after intranasal AdCre treatment. ****P<0.0001.
Extended Data Figure 9
Extended Data Figure 9. TTM does not reduce the weight of mice with tumors
Mean weight ± s.e.m. over time (days) of mice (n=4) injected with BRAFV600E-transformed, immortalized MEFs and treated with vehicle (black circle) or TTM (red square).
Extended Data Figure 10
Extended Data Figure 10. Graphical representation of Cu regulation of BRAFV600E-mediated signaling and tumorigenesis
Inactivation of the signaling pathway is denoted in grey and dashed lines, gain of function mutations are denoted in green and loss of function mutations are denoted in red.
Figure 1
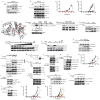
Figure 1. Binding of Cu to MEK1 promotes MAPK signaling and tumorigenesis by oncogenic BRAF
a,k,r,u RT-PCR and b,l,p,s,v immunoblot detection of the indicated endogenous, ectopic (ect), or both (end/ect) mRNA and phosphorylated (P) and/or total (T) proteins from cells. IP: immunoprecipitated. c,d,q,t,w Mean tumor volume (cm3) ± s.e.m. versus time (days) in mice injected with c, BRAFV600E-transformed Ctr1+/+ (black circle) or Ctr1-/- (red square) MEFs (n=4) d, BRAFV600E-transformed Ctr1-/- MEFs expressing no transgene (red square), CTR1 (black diamond), or CTR1M154A (blue open circle) (n=3) q, BRAFV600E-transformed Ctr1+/+ MEFs expressing scramble shRNA (black circle), Mek1 shRNA alone (red square) or with RNAi-resistant MEK1 (green open triangle) or MEK1CBM (blue open circle) (n=3) t, Ctr1-/- MEFs expressing BRAFV600E (red square, n=3) or MEK1-MEK5DD (black open square, n=4) or w, Ctr1-/- MEFs expressing BRAFV600E (red square, n=3), ERK2GOF (black diamond, n=3), ERK2R67S (yellow open triangle, n=4), or ERK2D321N (green open triangle, n=4). ** P<0.01. ***P<0.001.****P<0.0001. e, MEK1 structure (from PDB ID: 3EQD) denoting amino acids M187, H188, M230, and H239 and the intervening space (Å). f-j,m-o, Immunoblot detection of the indicated f,m recombinant proteins bound to a resin charged with or without Cu or g,h,i,j,n,o phosphorylated (P) or total (T) recombinant proteins with or without 50 μM TTM, a seven-fold increase in TTM from 0 to 50 μM, or either 2.5 molar equivalents or 2.5 μM CuSO4. Gel images are representative of at least two replicates.
Figure 2
Figure 2. Knockdown of CTR1 decreases MAPK signaling and tumorigenesis specifically by oncogenic BRAF
a, RT-PCR detection of the indicated mRNA b, immunoblot detection of the indicated phosphorylated (P) or total (T) proteins from cells and c, mean tumor volume (cm3) ± s.e.m. versus time (days) of mice injected (DM738 n=3, others n=4)) with the indicated cell lines expressing scramble (black circle) or CTR1 (red square) shRNA. *P<0.05. ***P<0.001. d, RT-PCR detection of the indicated endogenous or ectopic (ect) mRNA from cells and e, mean tumor volume (cm3) ± s.e.m. versus time (days) of mice (n=3) injected with CMYCT58A-transformed Ctr1+/+ (black circle) or Ctr1-/- (red square) MEFs. Gel images are representative of two replicates.
Figure 3
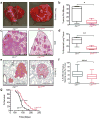
Figure 3. Genetic ablation of Ctr1 decreases MAPK signaling and tumorigenesis and extends the lifespan in a mouse model of BrafV600E-driven lung cancer
a, Representative resected (arrows: visible lesions, scale bar: 1cm) c, H&E stained (scale bar: 1mm) or e, immunohistochemical detection of P-ERK1/2 (red: positive pixels, scale bar: 500μm) of lungs of Ctr1+/+ or Ctr1flox/flox BP mice (a,c fixed or e, moribundity endpoint). b, Box and whiskers plot of tumors/mouse (n=5 lungs) d, mean % of area of abnormal lung tissue (n=5 lungs) and f, mean % P-ERK1/2 positive-staining area/lung tumor from Ctr1+/+ (n=199 tumors) versus Ctr1flox/flox (n=142 tumors) BP mice (b,d fixed or f, moribundity endpoint). g, Kaplan-Meier survival analysis of Ctr1+/+ (black line, n=30) versus Ctr1flox/flox (red line, n=30) BP mice. * P<0.05. ** P<0.01. ***P<0.001. ****P<0.0001.
Figure 4
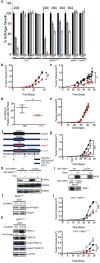
Figure 4. Pharmacological chelation of Cu reduces tumor growth of BRAFV600E-driven and vemurafenib-resistant tumor cells
a, Normalized % average soft agar growth ± s.e.m of Ctr1+/+ MEFs (plated in triplicate) expressing the indicated transgenes or the indicated cell lines treated with vehicle (black bar), 100 nM (grey bar), or 400nM (white bar) TTM. **** P<0.0001. Representative of three experiments. b,c,g,l Mean tumor volume (cm3) ± s.e.m. versus time (days) of tumors in mice (n=3) injected with b, BRAFV600E-transformed Ctr1+/+ MEFs c, DM440 cells or e, ERK2GOF-transformed Ctr1-/- MEFs and treated with either vehicle (black circle) or TTM (red square). *P<0.05.**P<0.01. d, Box and whiskers plot of % P-ERK1/2 positive-stained cells/field from tumors derived from mice (n=3) injected with BRAFV600E-transformed Ctr1+/+ MEFs and treated with vehicle (black line) or TTM (red line). *P<0.05. f, Dosing and diet regimen and g, mean tumor volume (cm) ± s.e.m. versus time (days) in mice (n=3) injected with BRAFV600E-transformed Ctr1+/+ MEFs and provided a copper-deficient diet (CuD) with either deionized H2O (diH2O) and treated 2 weeks with vehicle (Group A, black circle) or diH2O supplemented with CuSO4 and treated 2 weeks with vehicle (Group B, blue triangle), TTM (Group C, red square), or TTM then trientine (Group D, green open diamond). ***P<0.001. h, Immunoblot detection of the indicated mRNA and phosphorylated (P) or total (T) recombinant proteins with or without 50 μM TTM. i, Immunoblot detection of the indicated recombinant proteins bound to a resin charged with or without Cu. j, RT-PCR and k, immunoblot detection of indicated phosphorylated (P) or total (T) endogenous, ectopic (ect), or both (end/ect) proteins in A375 cells expressing HA-MEK1 or HA-MEK1C121S. l, Mean tumor volume (cm3) ± s.e.m. versus time (days) of mice injected with A375 cells expressing MEK1 (left) or MEK1C121S mutant (right) and treated with vehicle (black circle, n=4), TTM (red square, n=3), or vemurafenib (blue diamond, n=4). **P<0.01. ***P<0.001. Gel images are representative of at least two replicates.

Comment in

Similar articles

Cited by

References

    1. Davies H, et al. Mutations of the BRAF gene in human cancer. Nature. 2002;417:949–954. - PubMed
    1. Forbes SA, et al. COSMIC: mining complete cancer genomes in the Catalogue of Somatic Mutations in Cancer. Nucleic Acids Res. 2011;39:D945–950. - PMC - PubMed
    1. Wan PT, et al. Mechanism of activation of the RAF-ERK signaling pathway by oncogenic mutations of B-RAF. Cell. 2004;116:855–867. - PubMed
    1. Flaherty KT, et al. Improved survival with MEK inhibition in BRAF-mutated melanoma. N Engl J Med. 2012;367:107–114. - PubMed
    1. Flaherty KT, et al. Combined BRAF and MEK inhibition in melanoma with BRAF V600 mutations. N Engl J Med. 2012;367:1694–1703. - PMC - PubMed

Publication types

MeSH terms