. 2014 May 5;211(5):909-27.
doi: 10.1084/jem.20131065. Epub 2014 Apr 7.

Distinct, strict requirements for Gfi-1b in adult bone marrow red cell and platelet generation

Affiliations

Distinct, strict requirements for Gfi-1b in adult bone marrow red cell and platelet generation

Adlen Foudi et al. J Exp Med. .

Abstract

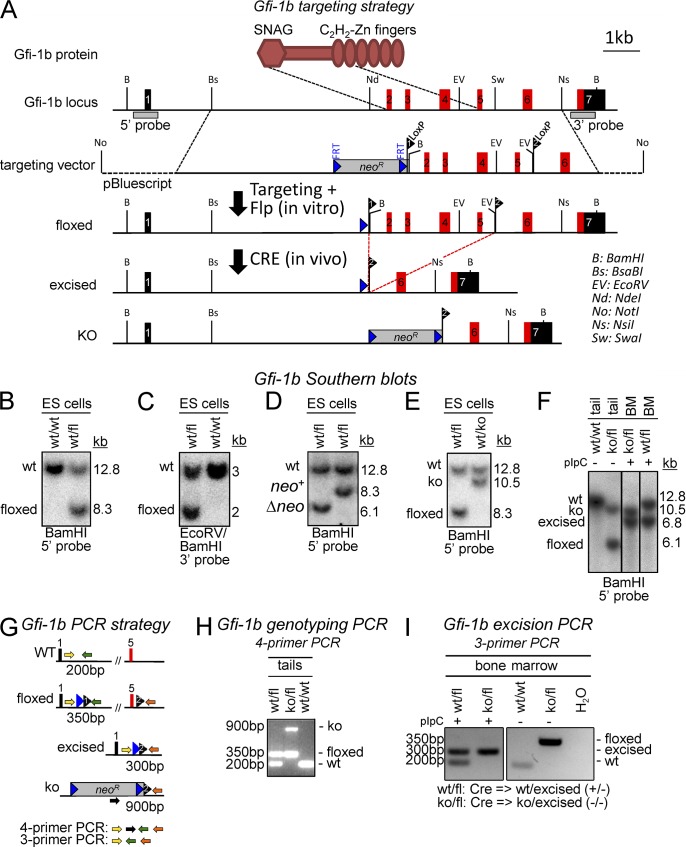
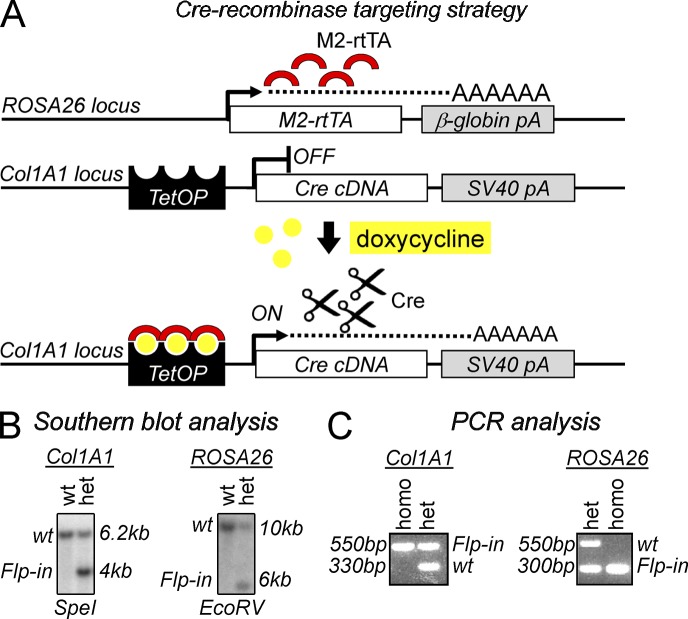
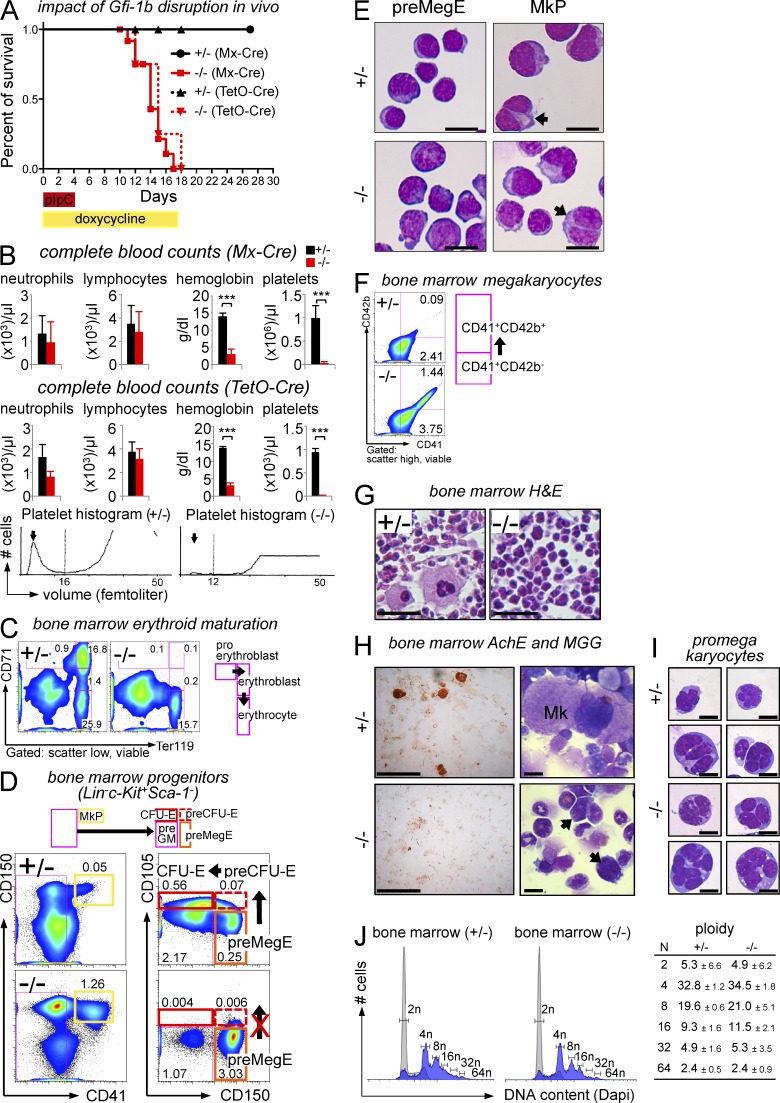
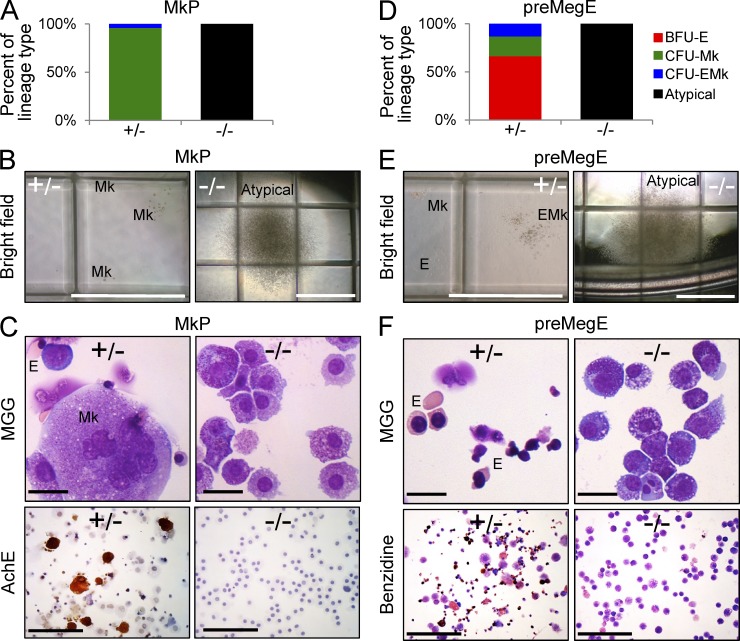
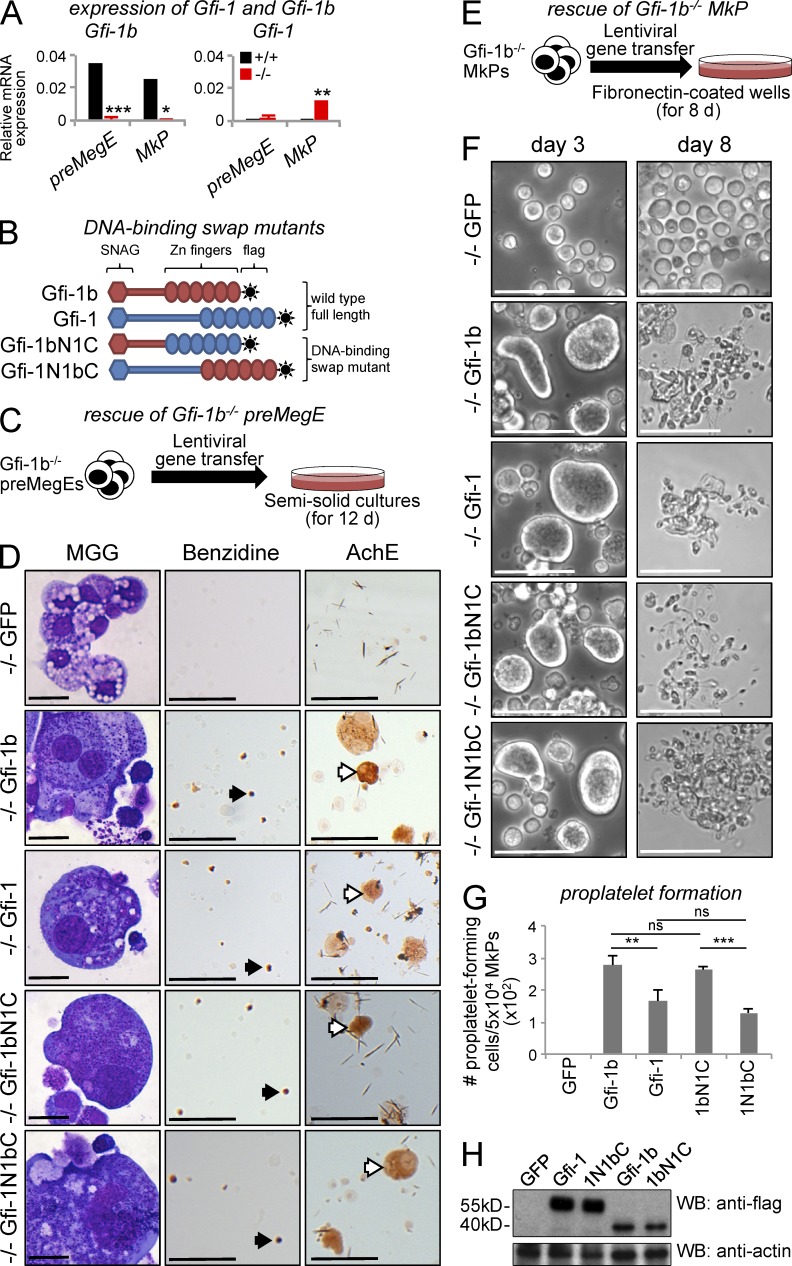
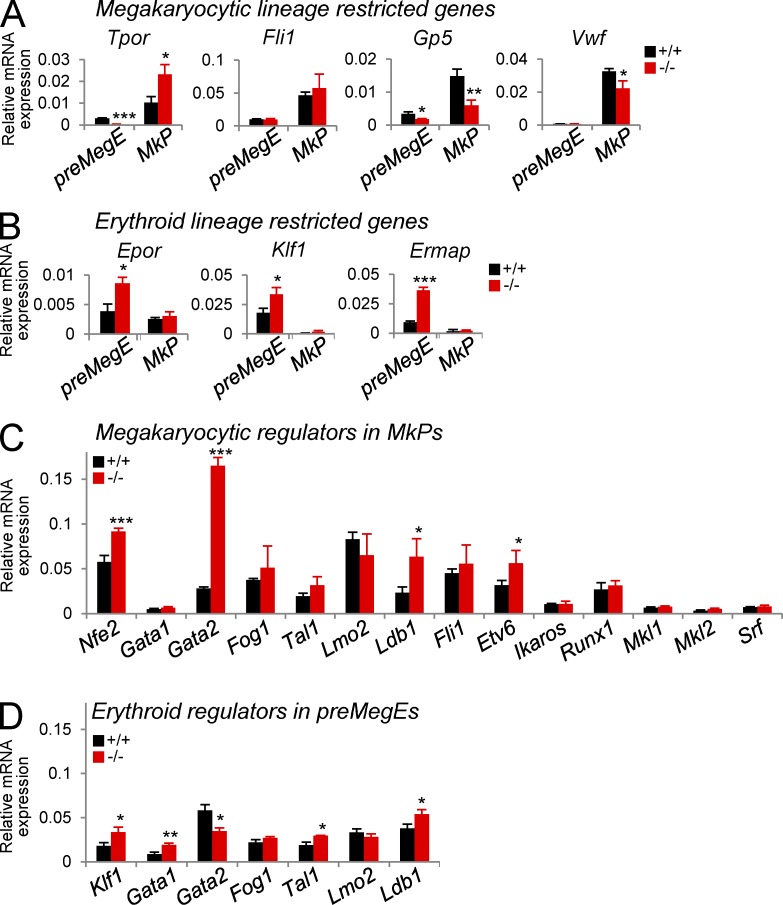
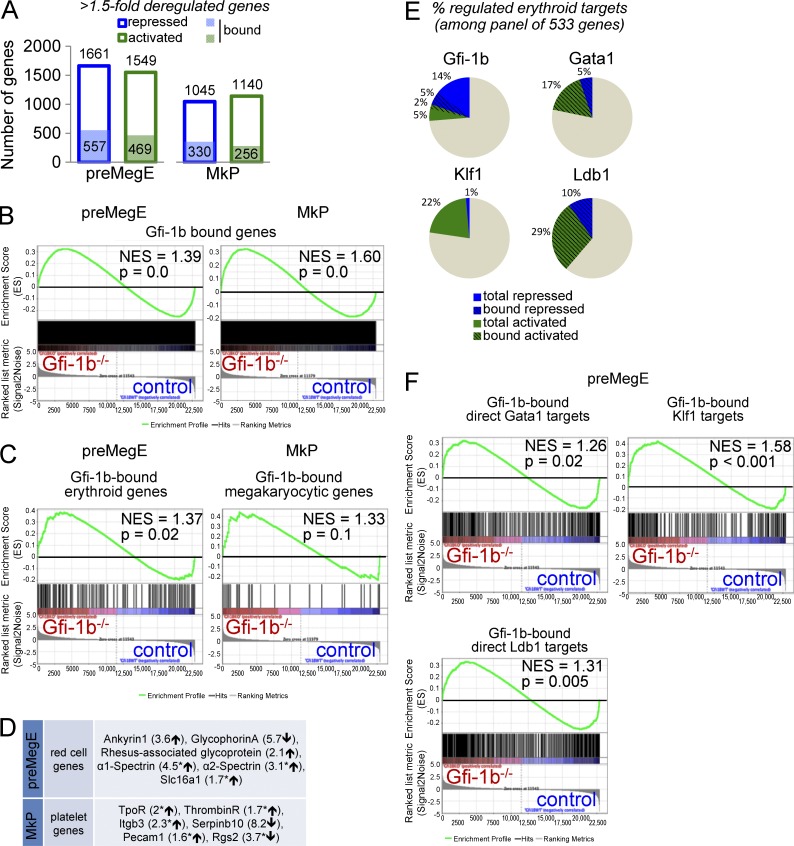
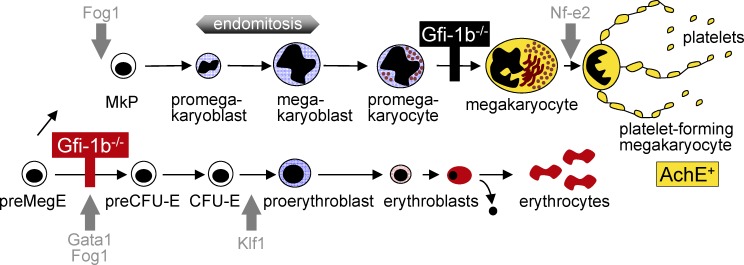
The zinc finger transcriptional repressor Gfi-1b is essential for erythroid and megakaryocytic development in the embryo. Its roles in the maintenance of bone marrow erythropoiesis and thrombopoiesis have not been defined. We investigated Gfi-1b's adult functions using a loxP-flanked Gfi-1b allele in combination with a novel doxycycline-inducible Cre transgene that efficiently mediates recombination in the bone marrow. We reveal strict, lineage-intrinsic requirements for continuous adult Gfi-1b expression at two distinct critical stages of erythropoiesis and megakaryopoiesis. Induced disruption of Gfi-1b was lethal within 3 wk with severely reduced hemoglobin levels and platelet counts. The erythroid lineage was arrested early in bipotential progenitors, which did not give rise to mature erythroid cells in vitro or in vivo. Yet Gfi-1b(-/-) progenitors had initiated the erythroid program as they expressed many lineage-restricted genes, including Klf1/Eklf and Erythropoietin receptor. In contrast, the megakaryocytic lineage developed beyond the progenitor stage in Gfi-1b's absence and was arrested at the promegakaryocyte stage, after nuclear polyploidization, but before cytoplasmic maturation. Genome-wide analyses revealed that Gfi-1b directly regulates a wide spectrum of megakaryocytic and erythroid genes, predominantly repressing their expression. Together our study establishes Gfi-1b as a master transcriptional repressor of adult erythropoiesis and thrombopoiesis.


Figures

Figure 1.
Figure 1.
Generation of a conditional Gfi-1b allele in ES cells and mice. (A) A scheme of the Gfi-1b protein domains illustrating the targeted regions is shown above the restriction maps. LoxP-flanked regions include coding exons for the entire N-terminal protein (ATG-ZF2). The restriction maps show the genomic Gfi-1b locus (top; coding exons in red and noncoding exons in black), the targeting vector (second), the targeted locus after Flp-mediated deletion of NeoR (third), and the excised locus (fourth). The bottom shows a constitutively deleted Gfi-1b allele (KO) generated by Cre-mediated deletion without excision of the NeoR gene. (B–F) Southern blot analyses of Gfi-1b alleles. (B) Documentation of correct targeting at 5′ (digest: BamHI; expected sizes: WT = 12.8 kb, targeted allele = 8.3 kb; probe: 5′ as shown in A). (C) Documentation of correct targeting at 3′ (digest: BamHI/EcoRV; expected sizes: WT = 3 kb, targeted allele = 2 kb; probe: 3′ as shown in A). (D) Documentation of deletion of neoR cassette using Flpe (digest: BamHI; expected sizes: WT = 12.8 kb, floxed-neo+ = 8.3 kb, floxed-Δneo = 6.1 kb; probe: 5′ as shown in A). (E) Documentation of Cre-mediated excision of exons 2–5 in ES cells to generate the constitutive KO allele (A, bottom; digest: BamHI; expected sizes: WT = 12.8 kb; floxed-neo+ = 8.3 kb; KO = 10.5 kb; probe: 5′ as shown in A). (F) Southern blot analysis for genotyping and determination of excision status (digest: BamHI; expected sizes: WT = 12.8 kb, floxed = 6.1 kb, excised = 6.8 kb, KO = 10.5 kb; probe: 5′ as shown in A). (G–I) Gfi-1b genotyping and excision PCR strategies. (G) Scheme of Gfi-1b PCR strategy. (H) Representative genotyping PCR using four primers as shown in G from tail-tip DNA samples (expected bands: WT, 200 bp; floxed, 350 bp; KO, 900 bp). (I) Representative excision PCR using three primers as shown in A from bone marrow cells before (−) and after (+) pIpC treatment (expected bands: WT, 200 bp; floxed, 350 bp; excised, 300 bp; KO, no band).
Figure 2.
Figure 2.
Generation of mice that permit doxycycline-inducible expression of Cre recombinase (TetO-Cre). (A) Alleles for doxycycline-inducible Cre expression. (top) The M2 reverse tetracycline transactivator (M2-rtTA) is constitutively transcribed off the ROSA26 promoter as described in Beard et al. (2006). (middle) Flp-recombinase–mediated site-specific integration was used as described previously (Beard et al., 2006) to insert the Cre cDNA in the 3′ UTR region of the Collagen (Col) 1A1 locus under the control of a tetracycline-dependent minimal CMV promoter. (bottom) Upon doxycycline treatment (yellow dots), the M2 reverse tetracycline transactivator (red semicircles) binds to the CMV promoter and Cre expression is turned on. pA, poly A; TetOP, tetracycline operator elements fused to CMV minimal promoter. (B) Southern blot analysis confirming integration of the Cre transgene in the Col1A1 locus (left) and M2-rtTA Flp-in the ROSA26 locus (right). ES cells double heterozygous for M2-rtTA and TetOP-Cre were used to generate chimeric animals and germline offspring (not depicted). (C) Representative products after three-primer competitive genotyping PCR for Col1A1 and ROSA26 loci from tail-tip genomic DNA. Col1A1 expected bands: Flp-in, 550 bp; WT, 330 bp. ROSA26 expected bands: Flp-in, 300 bp; WT, 550 bp. het, heterozygous; homo, homozygous.
Figure 3.
Figure 3.
Induced disruption of Gfi-1b in the bone marrow. (A) Kaplan–Meyer survival analysis after conditional Gfi-1b disruption using Mx-Cre (pIpC; +/− n = 15; −/− n = 13) or TetO-Cre (doxycycline; +/− n = 4; −/− n = 4). (B) Automated, complete blood counts after induction of Mx-Cre (top; +/− n = 5; −/− n = 6) or TetO-Cre (middle; days 12–19, +/− n = 4; −/− n = 4). Bottom panels show representative platelet volume histograms. (C) Flow cytometric analysis of bone marrow erythroid maturation (day 13). One representative of five independent experiments is shown. (D) Flow cytometric analysis of bone marrow progenitors (day 13; Pronk et al., 2007); monopotent erythroid progenitors (pre–CFU-E, CFU-E) were undetectable, but bipotent pre-MegEs and monopotent MkPs were increased after Gfi-1b loss. Numbers are frequencies of total bone marrow cells (representative of four independent experiments). (E) Cytospin preparations of flow-sorted pre-MegEs (left) and MkPs (right) stained with MGG. The morphology of both populations (including binucleated MkPs, arrows) was preserved after Gfi-1b disruption. (F) Flow cytometric analysis of bone marrow megakaryocyte maturation (day 15). CD41+CD42b+ megakaryocytic cells were increased ∼15-fold in Gfi-1b−/− bone marrow. Numbers are frequencies of total bone marrow cells (representative of four independent experiments). (G) H&E stain of whole mount bone marrows (day 15) showing the absence of mature megakaryocytes after Gfi-1b loss (−/−, right). (H) Histochemical analysis (left) and MGG stain (right) of total bone marrow cytospin preparations (day 15). After Gfi-1b disruption, no mature megakaryocytes were detected with AchE or MGG stains, but immature multilobulated megakaryocytic cells were abundant (arrows). (I) Cytospin preparations of flow-sorted Gfi-1b+/− (top) and Gfi-1b−/− (bottom three rows) CD41+CD42b+ megakaryocytic cells (MGG) showing high nuclear/cytoplasm ratio, basophilic cytoplasm, faint azurophilic granules, and multilobulated nuclei. Bars: (E, H [right], and I) 10 µm; (G) 50 µm; (H, left) 100 µm. (J) Flow cytometric analysis of bone marrow cell ploidy (day 15). Combined lymphoid plus granulocytic scatter gates were used as internal diploid control (gray histograms), and scatter high gates were used to enrich for megakaryocytic cells (blue histograms). The distribution of cells with high ploidy was preserved after Gfi-1b disruption. Table shows mean ± SD of ploidy data from two independent experiments. Significance was determined with two-tailed Student’s t test: ***, P < 0.001. Error bars denote SDs.
Figure 4.
Figure 4.
Megakaryocytic and erythroid lineage–intrinsic requirements for Gfi-1b in vitro. (A–C) Colony formation from sorted MkPs (days 15–19 after Cre induction; SCF, IL-3, IL-11, GM-CSF, Epo, and Tpo). (A) Distribution of colonies with the indicated morphologies by phase-contrast microscopy (BFU-E, erythroid; CFU-Mk, megakaryocyte; CFU-EMk, erythroid/megakaryocyte; atypical; based on >300 colonies per genotype; three independent experiments scored days 7–10). (B) Microscopic morphologies of typical CFU-Mks and large atypical colonies from Gfi-1b−/− MkPs. (C) Cytospin preparations of pooled colonies stained with MGG (top) and AchE (bottom; representative results of three independent experiments). Gfi-1b−/− MkPs failed to produce typical megakaryocyte colonies but gave rise to large atypical colonies that did not contain mature megakaryocytes. (D–F) Colony formation from sorted bipotent megakaryocyte/erythrocyte progenitors (pre-MegEs; conditions as in A–C). (D) Distribution of colony types (as detailed in A, >300 colonies per genotype, three experiments). (E) Morphologies of typical BFU-Es, CFU-Mks, and CFU-EMks and large, atypical colonies from Gfi1b−/− pre-MegEs. (F) Cytospin preparations of pooled colonies stained with MGG (top) or benzidine (bottom; representative results of three independent experiments). The large atypical colonies from Gfi-1b−/− pre-MegEs did not contain mature erythroid cells (top) or benzidine-reactive (hemoglobin producing) cells (bottom). Bars: (B and E) 1 mm; (C and F, top) 10 µm; (C and F, bottom) 100 µm.
Figure 5.
Figure 5.
The megakaryocytic and erythroid defects after loss of Gfi-1b are blood cell autonomous in vivo. (A) Scheme of the experiment. (B) Automated, complete blood counts after 4 wk of doxycycline treatment in Gfi-1b+/− (n = 5) and Gfi-1b−/− (n = 6) posttransplant recipients. Error bars represent SD. (C) Analysis of Gfi-1b gene status by PCR in sorted bone marrow populations in posttransplant recipients. Genomic DNA of sorted Gr1+Mac1+ neutrophils, pre-MegEs, MkPs, CD71+Ter119+ erythroblasts, CD41+CD42+ megakaryocytic cells was analyzed by competitive PCR 7 wk after doxycycline treatment (19 wk after transplant; fl, floxed; ex, excised; see Fig. 1 [G and I]). All populations predominantly contained Gfi-1b−/− cells, except for erythroblasts, which exclusively contained WT cells from competitor marrow (representative of two independent experiments). (D) Flow cytometric analysis of bone marrow progenitors 7 wk after doxycycline treatment in Gfi-1b+/− (top) and Gfi-1b−/− (bottom) posttransplant recipients. CFU-E progenitors were almost all derived from competitor cells (red frame and histogram) in Gfi-1b−/− posttransplant mouse compared with Gfi-1b+/− controls. (E and F) Combination of quantitative imaging and flow cytometric analysis of CD41+CD42+ megakaryocytes in Gfi-1b+/− and Gfi-1b−/− posttransplant recipients, 7 wk after doxycycline treatment. Bone marrow cells were stained with CD45.2 FITC (green pseudocolor), CD42 PE (yellow pseudocolor), CD41 Pacific Blue (purple pseudocolor), and DRAQ5 (DNA; red pseudocolor) and analyzed using Amnis ImageStream MkII. (E) Representative images of competitor cell–derived (comp) CD45.2-negative and conditional cell–derived (cond) CD45.2-positive CD41+CD42+ megakaryocytes in Gfi1b+/− (top) and Gfi1b−/− (bottom) posttransplant recipients. Note that Gfi1b−/− megakaryocytes are dramatically smaller than their WT counterparts. Bars, 10 µm. (F) Quantification of size of competitor cell–derived and conditional cell–derived CD41+CD42+ megakaryocytes in Gfi1b+/− (top) and Gfi1b−/− (middle) posttransplant recipients. Table shows mean ± SD of CD41 and CD42 area scales for a total of 93 and 195 CD41+CD42+ megakaryocytes analyzed from Gfi1b+/− and Gfi1b−/− posttransplant recipients, respectively.
Figure 6.
Figure 6.
Rescue of erythroid and megakaryocytic colony formation and proplatelet formation from Gfi-1b−/− progenitors ex vivo. (A) Gfi-1b (left) and Gfi-1 (right) mRNA expression analysis in Gfi-1b+/+ and Gfi-1b−/− pre-MegE and MkP bone marrow progenitors. mRNA expression relative to β-actin expression is shown as mean ± SD of three independent biological replicates (***, P < 0.001; **, P < 0.005; *, P < 0.05; two-tailed Student’s t test). (B) Scheme of Gfi-1b/Gfi-1 hybrids. In the Gfi-1bN1C mutant (third row), the N terminus of Gfi-1b was fused to the C terminus of Gfi-1. In the Gfi-1N1bC mutant (fourth row), the C terminus of Gfi-1b was fused to the N terminus of Gfi-1. (C) Scheme of the Gfi-1b−/− pre-MegE rescue. (D) Representative cytospin preparations of progenitor colonies on day 12 after lentiviral gene transfer of Gfi-1b−/− pre-MegEs with GFP alone (first row), Gfi-1b with GFP (second row), Gfi-1 with GFP (third row), Gfi-1bN1C with GFP (fourth row), and Gfi-1N1bC with GFP (fifth row). Colonies were stained with MGG (left) and benzidine (middle) and for AchE activity (right). Note the presence of benzidine+ erythrocytes (black arrows) and AchE+ megakaryocytes (white arrows) after transduction of Gfi-1b, Gfi-1, Gfi-1bN1C, and Gfi-1N1bC but not GFP alone. (E) Scheme of the Gfi-1b−/− MkP rescue. (F–H) Analysis of proplatelet formation from Gfi-1b−/− MkPs. (F) Representative phase-contrast micrographs on days 3 (left) and 8 (right) after lentiviral gene transfer of GFP alone (first row), Gfi-1b with GFP (second row), Gfi-1 with GFP (third row), Gfi-1bN1C with GFP (fourth row), and Gfi-1N1bC with GFP (fifth row). Note the formation of proplatelet-forming megakaryocytes in all conditions but GFP alone. Bars: (D, left) 10 µm; (D, middle and right) 100 µm; (F) 50 µm. (G) Quantification of proplatelet formation 8 d after infection of Gfi-1b−/− MkPs. Note that the efficiency of Gfi-1b and Gfi-1bN1C in giving rise to proplatelet is comparable and significantly higher than that of Gfi-1 or Gfi-1N1bC. Data are shown as means ± SD of the number of proplatelet-forming megakaryocytes in three independent experiments (***, P < 0.001; **, P < 0.005; two-tailed Student’s t test). (H) Western blot analysis using M2 anti-flag antibody (top) in day 8 megakaryocytic cultures derived from infected Gfi-1b−/− MkPs. Expression level of β-actin (bottom, same blot after stripping) was used as a control for loading.
Figure 7.
Figure 7.
Pre-MegEs and MkPs partially preserve their molecular program after Gfi-1b loss. (A–D) Analysis of gene expression in sorted Gfi-1b+/+ and Gfi-1b−/− pre-MegEs and MkPs. (A) Analysis of megakaryocytic lineage–restricted genes (Tpor, thrombopoietin receptor; Fli1; Gp5, platelet glycoprotein V; Vwf, Von Willebrand factor). (B) Analysis of erythroid lineage–restricted genes (Epor, erythropoietin receptor; Klf1, [Eklf]; Ermap, erythroid membrane-associated protein). (C) Analysis of megakaryocytic transcriptional regulators in MkPs (Nfe2, Gata1, Gata2, Fog1, Tal1 [Scl], Lmo2, Ldb1, Fli1, Etv6 [Tel], Ikaros, Runx1 [Aml1], Mkl1, Mkl2, and Srf). (D) Analysis of erythroid transcriptional regulators in pre-MegEs (Klf1 [Eklf], Gata1, Gata2, Fog1 [Zfpm1], Tal1 [Scl], Lmo2, and Ldb1). mRNA expression relative to β-actin expression is shown as mean ± SD of three independent biological replicates (***, P < 0.001; **, P < 0.005; *, P < 0.05; two-tailed Student’s t test).
Figure 8.
Figure 8.
Genome-wide analysis of Gfi-1b’s impact on megakaryocytic and erythroid gene expression in progenitors. (A) Affymetrix Mouse GeneChip 1.0 ST microarray analysis of control and Gfi-1b−/− pre-MegEs (left; gene list in Table S1) and MkPs (right; gene list in Table S2). Shown are numbers of genes with 1.5-fold expression changes after Gfi-1b disruption (blue frame: repressed genes; green frames: activated genes). Numbers of direct Gfi-1b targets are shown in filled blue and green boxes (peaks defined as −10 kb from transcription start site to 1 kb from gene end, based on a published ChIP-seq gene set [Wilson et al., 2010]; see Table S3). (B) GSEA of control and Gfi-1b−/− pre-MegEs (left) and MkPs (right) with Gfi-1b–bound gene set (see Table S3). (C) GSEA of control and Gfi-1b−/− pre-MegEs (left) and MkPs (right) with Gfi-1b–bound erythroid gene set (left; 155 Gfi-1b–bound/533 literature-defined genes [Li et al., 2013]; see Table S3) or Gfi-1b–bound megakaryocytic gene set (right; 31 Gfi-1b–bound/57 literature-defined genes [Chen et al., 2007]; see Table S3). (D) Examples of erythroid and megakaryocytic lineage genes that are deregulated after loss of Gfi-1b in pre-MegEs and MkPs. Asterisks indicate Gfi-1b–bound genes (Table S3). (E) Pie charts for comparison of the ratio of repressed and activated literature-defined erythroid genes (Li et al., 2013) by Gfi-1b (top left; Table S1), Gata1 (top right; Yu et al., 2009), Klf1 (bottom left; Tallack et al., 2012), and Ldb1 (bottom right; Li et al., 2013). Dashed lines indicate bound targets. (F) GSEA of control and Gfi-1b−/− pre-MegEs with Gfi-1b–bound, regulated direct Gata1 targets (top left; 355 Gfi-1b–bound/791 Gata1 targets [Yu et al., 2009]; see Table S3), Gfi-1b–bound regulated Klf1 targets (top right; 242 Gfi-1b–bound/813 Klf1-regulated genes [Tallack et al., 2012]; see Table S3), and Gfi-1b–bound, regulated direct Ldb1 targets (bottom; 553 Gfi-1b–bound/1,206 Ldb1 targets [Li et al., 2013]; see Table S3). NESs and nominal p-values are shown for all GSEAs.
Figure 9.
Figure 9.
Schematic representation of Gfi-1b’s role in normal erythropoiesis and thrombopoiesis. The top illustrates the position of the block that follows Gfi-1b disruption in megakaryocytic lineage maturation (black bar). The bottom shows the position of the erythroid lineage block after Gfi-1b loss (red bar). Gray arrows indicate the positions of blocks that follow loss of other lineage regulators.

Similar articles

Cited by

References

    1. Akashi K., Traver D., Miyamoto T., Weissman I.L. 2000. A clonogenic common myeloid progenitor that gives rise to all myeloid lineages. Nature. 404:193–197 10.1038/35004599 - DOI - PubMed
    1. Beard C., Hochedlinger K., Plath K., Wutz A., Jaenisch R. 2006. Efficient method to generate single-copy transgenic mice by site-specific integration in embryonic stem cells. Genesis. 44:23–28 10.1002/gene.20180 - DOI - PubMed
    1. Blobel G.A., Nakajima T., Eckner R., Montminy M., Orkin S.H. 1998. CREB-binding protein cooperates with transcription factor GATA-1 and is required for erythroid differentiation. Proc. Natl. Acad. Sci. USA. 95:2061–2066 10.1073/pnas.95.5.2061 - DOI - PMC - PubMed
    1. Buchholz F., Angrand P.O., Stewart A.F. 1998. Improved properties of FLP recombinase evolved by cycling mutagenesis. Nat. Biotechnol. 16:657–662 10.1038/nbt0798-657 - DOI - PubMed
    1. Capron C., Lacout C., Lécluse Y., Wagner-Ballon O., Kaushik A.L., Cramer-Bordé E., Sablitzky F., Duménil D., Vainchenker W. 2011. LYL-1 deficiency induces a stress erythropoiesis. Exp. Hematol. 39:629–642 10.1016/j.exphem.2011.02.014 - DOI - PubMed

Publication types

MeSH terms