. 2014 May 6;19(5):810-20.
doi: 10.1016/j.cmet.2014.03.025. Epub 2014 Apr 4.

A smooth muscle-like origin for beige adipocytes

Affiliations

A smooth muscle-like origin for beige adipocytes

Jonathan Z Long et al. Cell Metab. .

Abstract

Thermogenic UCP1-positive cells, which include brown and beige adipocytes, transform chemical energy into heat and increase whole-body energy expenditure. Using a ribosomal profiling approach, we present a comprehensive molecular description of brown and beige gene expression from multiple fat depots in vivo. This UCP1-TRAP data set demonstrates striking similarities and important differences between these cell types, including a smooth muscle-like signature expressed by beige, but not classical brown, adipocytes. In vivo fate mapping using either a constitutive or an inducible Myh11-driven Cre demonstrates that at least a subset of beige cells arise from a smooth muscle-like origin. Finally, ectopic expression of PRDM16 converts bona fide vascular smooth muscle cells into Ucp1-positive adipocytes in vitro. These results establish a portrait of brown and beige adipocyte gene expression in vivo and identify a smooth muscle-like origin for beige cells.


Figures

Fig. 1
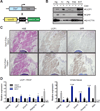
Fig. 1. Characterization of the UCP1-TRAP mouse
(A) Schematic of the cross to generate UCP1-TRAP mice. A BAC transgenic expressing Ucp1-Cre was crossed with a TRAP mouse expressing a fusion protein of eGFP and the ribosomal subunit L10a (eGFP-L10a, referred to as the TRAP allele) under the control of a lox-stop-lox cassette in the rosa26 locus. (B) Western blot analysis of UCP1, GFP, and β-actin loading control from various fat depots in 6-week old UCP1-TRAP mice at room temperature (−) or after two weeks cold exposure (+) at 4°C. Ing, inguinal WAT; Ax, axillary WAT; Pg, perigonadal WAT; Mes, mesenteric WAT. (C) Representative H&E, UCP1, and GFP immunohistochemistry from 6-week old male UCP1-TRAP (Cre-positive, TRAP-positive) or control mice (Cre-negative, TRAP-positive) after two weeks cold exposure at 4°C. (D) Relative mRNA expression of the indicated genes from various fat depots in UCP1-TRAP samples (left) or whole tissues (right). Tissues were harvested from 6-week old female mice after two weeks cold exposure at 4°C. Data are presented as means ± standard error; n = 3–5/group. *, ** p < 0.05 or < 0.01, respectively, in BAT versus pgWAT samples; #, ## p < 0.05 or < 0.01, respectively, in BAT versus iWAT samples.
Fig. 2
Fig. 2. Identification of the common brown and beige gene expression signature in vivo
(A–C) The average signal intensities (FPKM) for genes in the UCP1-TRAP-Seq dataset are pair-wise compared between depots. Pearson’s correlation coefficient (r) for each comparison is shown as an insert. n = 2 for pgWAT and n = 3 for iWAT and BAT. UCP1-TRAP-Seq samples were obtained from 6-week old female mice following two weeks cold exposure at 4°C. (D) Pie chart showing the fraction of total detected genes from UCP1-TRAP-Seq classified as either “equivalent” (ratio ≤ 3) or “different” (ratio > 3) (also see Experimental Procedures). (E) Scatter plot showing the ratio metric versus average signal intensity for the top one hundred most abundant UCP1-TRAP-Seq genes. Abundance was determined by total FPKM detected across all UCP1-TRAP-Seq samples.
Fig. 3
Fig. 3. Analysis of differentially expressed genes
(A) Hierarchical clustering of the differentially expressed genes (ratio > 3) from the UCP1-TRAP-Seq dataset. Rows and columns were each clustered using the one minus Pearson correlation distance metric. Clustering was performed with the average signal intensity for each depot. n = 2 for pgWAT and n = 3 for iWAT and BAT. (B) Relative expression by qPCR of most abundant iWAT-selective UCP1-TRAP genes (Group 3) from both UCP1-TRAP samples and from whole tissues across depots. n = 3/group; the average signal intensity is shown. For (A) and (B), red and blue indicate relative high and low expression, respectively, for the column.
Fig. 4
Fig. 4. Identification of anatomy-independent markers for UCP1-positive cells from each depot
(A) Scatter plot of the most BAT-selective genes (Group 1 in Fig. 3A) between interscapular WAT or interscapular BAT tissues. (B and C) Scatter plot of the most pgWAT-selective (Group 2) or iWAT-selective (Group 3) genes between UCP1-TRAP and Adipoq-TRAP samples from the pgWAT (B) or iWAT depot (C). The bottom right quadrant, as marked by the dashed green lines, denote genes with p < 0.05 and FC > 2 for the indicated comparison; genes from groups 1–3 in this category are highlighted in red. As positive controls, the expression of Ucp1 Prdm16, and Ppargc1a are shown in grey. Blue dots indicate those genes that are not statistically significantly enriched or those with FC < 2 for the indicated comparison. n = 4–6/group.
Fig. 5
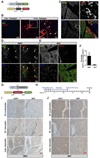
Fig. 5. Smooth muscle-like origin of beige cells
(A) Schematic of the cross to generate Myh11-GFP/tdTomato reporter mice. Transgenic mice expressing a bicistronic transgene consisting of Cre and eGFP under the control of 16 kb of the Myh11 promoter were crossed with tdTomato reporter mice. (B) GFP immunofluorescence and endogenous tomato fluorescence in the iWAT pad. Representative reporter mice (Cre-positive, tomato-positive) and control mice (Cre-negative, tomato-positive) are shown. (C–E) Perilipin (C) or UCP1 (D and E) immunofluorescence and endogenous Tomato fluorescence in iWAT (C and D) or BAT (E). (F) Quantification of double tdTomato+; UCP1+ cells as a percentage of total UCP1-positive cells from iWAT and BAT of Myh11-GFP/tdTomato reporter mice. Data are shown as means ± standard error; n = 3 mice per group. * p < 0.05 for iWAT versus BAT. (G) Schematic of the cross to generate Myh11-CreERT2/GFP reporter mice. BAC transgenic mice expressing a CreERT2 allele under the control of the Myh11 promoter were crossed to GFP (ROSAmT/mG) reporter mice. (H) Cartoon depicting the time course for tamoxifen injections, the washout period, and cold exposure. Tamoxifen was injected at 2 mg/mouse/day for four consecutive days prior to the washout period. (I, J) Immunohistochemical staining of tissues from day 25 for UCP1 (left panels) or GFP (right panels) in the iWAT (I) or BAT (J) of Myh11-CreERT2/GFP reporter mice. For both reporter experiments, mice were heterozygous for Cre and heterozygous for the reporter gene. For B–F, representative images were taken in 6-week old female Myh11-GFP/tdTomato reporter mice following two weeks cold exposure at 4°C. For I–J, representative images were taken in 8-week old male Myh11-CreERT2/GFP reporter mice following the treatment scheme indicated in (H).
Fig. 6
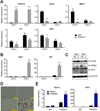
Fig. 6. Conversion of primary aortic SMCs into thermogenic adipocytes
(A and B) Relative expression of the indicated genes in primary murine aortic SMCs. SMCs were transduced with retrovirus overexpressing PRDM16 or GFP control and then selected with puromycin. Day 0 indicates the gene expression before differentiation. Day 6 indicates gene expression after two days of an adipogenic cocktail followed by five days of insulin, rosiglitazone, and triiodothyronine. Data are presented as means ± standard error; n = 3–5/group. *, ** p < 0.05 or < 0.01, respectively, in GFP- versus PRDM16-overexpressing samples at the same time point. (C) Western blot analysis of ACTA2, PPARG, UCP1, and β-actin loading control from primary aortic murine SMCs at the indicated times. G, GFP; PR, PRDM16. (D) Oil red O staining of primary murine aortic SMCs with the indicated overexpressing construct and at the indicated times. (E) Relative expression of the indicated genes in primary murine aortic SMCs at day 6, after 4 h treatment with DMSO or forskolin (10 µM). Data are presented as means ± standard error; n = 3–5/group. *, ** p < 0.05 or < 0.01, respectively, in forskolin-treated versus DMSO-treated within the same overexpressing group.

Comment in

  • Fat or fiction: origins matter.
    Wan DC, Longaker MT. Wan DC, et al. Cell Metab. 2014 Jun 3;19(6):900-1. doi: 10.1016/j.cmet.2014.05.007. Cell Metab. 2014. PMID: 24896537

Similar articles

Cited by

References

    1. Berry R, Rodeheffer MS. Characterization of the adipocyte cellular lineage in vivo. Nature cell biology. 2013;15:302–308. - PMC - PubMed
    1. Bostrom P, Wu J, Jedrychowski MP, Korde A, Ye L, Lo JC, Rasbach KA, Bostrom EA, Choi JH, Long JZ, et al. A PGC1-alpha-dependent myokine that drives brown-fat-like development of white fat and thermogenesis. Nature. 2012;481:463–468. - PMC - PubMed
    1. Cannon B, Nedergaard J. Brown adipose tissue: function and physiological significance. Physiological reviews. 2004;84:277–359. - PubMed
    1. Cederberg A, Gronning LM, Ahren B, Tasken K, Carlsson P, Enerback S. FOXC2 is a winged helix gene that counteracts obesity, hypertriglyceridemia, and diet-induced insulin resistance. Cell. 2001;106:563–573. - PubMed
    1. Cohen P, Levy JD, Zhang Y, Frontini A, Kolodin DP, Svensson KJ, Lo JC, Zeng X, Ye L, Khandekar MJ, et al. Ablation of PRDM16 and Beige Adipose Causes Metabolic Dysfunction and a Subcutaneous to Visceral Fat Switch. Cell. 2014;156:304–316. - PMC - PubMed

Publication types

MeSH terms