. 2014 Apr 3:15:7.
doi: 10.1186/1471-2199-15-7.

A novel, non-radioactive eukaryotic in vitro transcription assay for sensitive quantification of RNA polymerase II activity

Affiliations

A novel, non-radioactive eukaryotic in vitro transcription assay for sensitive quantification of RNA polymerase II activity

Cristina Voss et al. BMC Mol Biol. .

Abstract

Background: Many studies of the eukaryotic transcription mechanism and its regulation rely on in vitro assays. Conventional RNA polymerase II transcription assays are based on radioactive labelling of the newly synthesized RNA. Due to the inefficient in vitro transcription, the detection of the RNA involving purification and gel electrophoresis is laborious and not always quantitative.

Results: Herein, we describe a new, non-radioactive, robust and reproducible eukaryotic in vitro transcription assay that has been established in our laboratory. Upon transcription, the newly synthesized RNA is directly detected and quantified using the QuantiGene assay. Alternatively, the RNA can be purified and a primer extension followed by PCR detection or qPCR quantification can be performed. When applied to assess the activity of RNA polymerase II inhibitors, this new method allowed an accurate estimation of their relative potency.

Conclusions: Our novel assay provides a non-radioactive alternative to a standard in vitro transcription assay that allows for sensitive detection and precise quantification of the newly transcribed, unlabelled RNA and is particularly useful for quantification of strong transcriptional inhibitors like α-amanitin. Moreover, the method can be easily adapted to quantify the reaction yield and the transcription efficiency of other eukaryotic in vitro systems, thus providing a complementary tool for the field of transcriptional research.


Figures

Figure 1
Figure 1
Chemical structure of α-amanitin and amanitin-analogs tested in this paper. A. α-amanitin. B. O-methyl-γ-amanitin. C. HDP30.0378 [R = (CH2)6-NH2], HDP30.0516 [R = (CH2)8-NH2] and HDP30.0592 [R = (CH2)4-NH2]. D. HDP30.0346. E. HDP30.0445 [R = CH(CH3)–CH2-CH3] and HDP30.0528 [R = CH2-OH]. F. HDP30.0470 [R1 = CH(CH3)–CH2-CH3, R2 = H] , HDP30.0797 [R1 = phenyl, R2 = H], HDP30.0841 [R1 = 4-flour-phenyl, R2 = H], HDP30.0890 [R1 = 4-hydroxy-phenyl, R2 = H] and HDP30.0931 [R1 = CH2-OH, R2 = CH2-OH].
Figure 2
Figure 2
Detection of newly synthesized RNA by primer extension and PCR.In vitro transcription was performed on the pEGFP-N1 plasmid (A) or linearized CMV-EGFP template (B). The RNA was purified, reverse transcribed and detected by PCR. A. Gel analysis of the PCR products demonstrating α-amanitin-sensitive RNA synthesis. 1- DNA ladder; 2- no α-amanitin; 3- 100 μM α-amanitin; 4- negative transcription control (without NTPs); 5- positive PCR control; 6- DNase digested DNA control; 7- water PCR control. B. The visualized PCR product amount inversely correlated with the α-amanitin concentration. 1- DNA ladder; 2- no α-amanitin; 3-5- 400, 100 and 20 μM α-amanitin, respectively; 6-8- 400, 100 and 20 μM synthetic amanitin analog 30.0346, respectively; 9- negative transcription control (without NTPs); 10- positive PCR control; 11-water PCR control.
Figure 3
Figure 3
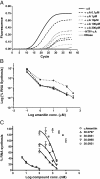
Detection of newly synthesized RNA by primer extension and qPCR.In vitro transcription was performed on the pEGFP-N1 plasmid (A, C) or linearized CMV-EGFP template (B, C, D). The RNA was purified, reverse transcribed and detected by qPCR. A. qPCR amplification curves of the primer-extension products from A as detected by a sequence-specific LNA probe. The C(T) value of the α-amanitin-inhibited probe (+αA 100 μM) of 22.3 was significantly lower than that of the probe generated without amanitin (−αA, c(T) = 17.6) indicating significantly lower RNA amounts. B. qPCR amplification of RNA/cDNA after in vitro transcription from the linear template CMV-EGFP in the presence of 5-100 μM α-amanitin showed no clear α-amanitin-concentration dependency. -αA – positive transcription (without α-amanitin, C(T) = 16.1); +αA – α-amanitin-inhibited transcription, C(T) values 27.9, 37.0, 28.1 and 24.5 for 100, 50, 20 and 2 μM, respectively; −NTP/-αA – negative control transcription; DNase - DNase digested DNA control. C. Amplification curves of RNA products from three different experiments (Exp1-Exp3). Positive transcription reactions performed at different occasions resulted in very similar C(T) values of 17.6, 18.0 and 16.1 for Exp1, 2 and 3, respectively. No amplification occurred for the negative controls. Note that the inhibitory effect of α-amanitin was dramatically increased when the linearized template CMV-EGFP was used for transcription (Exp3, C(T) = 27.9), when compared to Exp1 and Exp2 (C(T) values 22.3 and 21.7, respectively), were the supercoiled plasmid pEGP-N1 was used as a template. αA – transcription without α-amanitin; +αA - transcription in the presence of α-amanitin; −NTP/-αA – negative control transcription. D. Semi-quantitative estimation of the relative inhibitory activity of α-amanitin and several semisynthetic and synthetic analogs. 6–O-Met-γ-Ama = 6′-O-methyl-γ-amanitin; Amanitin = α-amanitin. Two different charges of the analog HDP30.0470 were tested.
Figure 4
Figure 4
Quantitative analysis of RNA synthesis by optimized qPCR.In vitro transcription was performed using the linear, bead immobilized DNA template Bead-HS-DNA. Each reaction was performed in duplicate. The RNA was purified, DNase digested and analyzed by reverse transcription followed by qPCR amplification. A. The amplification curves of RNA products derived from uninhibited and α-amanitin-containing reactions showed gradually decreasing C(T) values with increasing α-amanitin concentrations. For each type of reaction, the average fluorescence values were plotted. -αA – transcription reactions without α-amanitin; +αA - transcription reactions in the presence of α-amanitin; −NTP/-αA – negative control transcription reactions. B. Graphic representation of the calculated percent RNA synthesis in the presence of amanitin derived from the qPCR curves presented in A and from two additional similar experiments. Due to the high amanitin concentrations used, the residual percent RNA synthesis was lower than 10% and is depicted in a logarithmic scale. C. The optimized method was used to compare the inhibitory activity of amanitin to that of four synthetic analogs. B &C. The newly synthesized RNA amount was calculated using a DNA standard curve. By relating to the RNA amount synthesized in the uninhibited reactions a residual percent RNA synthesis was calculated. Bars show standard deviation.
Figure 5
Figure 5
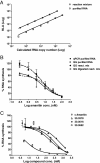
Quantitative analysis of RNA synthesis by QuantiGene method. A &B: In vitro transcription reactions were performed using the linear, bead immobilized DNA template Bead-HS-DNA. Half of each reaction mixture was subsequently used for RNA cleanup and the RNA amount was analyzed by the optimized qPCR method. A. Dilutions were either prepared directly from the reaction mixture or from the purified RNA. Each dilution was assessed as a 4-fold replicate by the QG method. The chemoluminescence signals were plotted against the expected RNA copy number, showing a clear linear relationship. Error bars show standard deviation. B. The optimized qPCR method was used to quantitate RNA inhibition by α-amanitin as described in Figure 4. In parallel, purified RNA, diluted reaction mixtures or DNase-digested reaction mixture dilutions were analyzed by the QG-method. Percent RNA synthesis was calculated by relating the luminescence signals of the respective α-amanitin-reaction to the signal of the uninhibited reaction. The QG method provided clear α-amanitin-concentration dependency curves using unpurified RNAs directly from the reaction mixture. C. The QG-method was applied to compare the inhibitory activity of α-amanitin to that of three semisynthetic derivatives. Bars show the standard deviation of the duplicate samples.
Figure 6
Figure 6
Comparison of the QuantiGene and qPCR methods as used for assessing the inhibitory effect of flavopiridol. A &B. Transcription reactions in the presence of α-amanitin or flavopiridol were set up using the standard DNA template HS-DNA and performed following the standardized protocol as described in the Additional file 3. C &D. A 98 pb longer DNA template, HS-DNA_long, was used to set up transcription reactions in the presence of α-amanitin or flavopiridol. Reaction conditions were similar to the experiment in A &B except for a shorter incubation period of 10 min instead of 30 min in the standard setting. To quantitate the RNA synthesis yield, the optimized, standardized QG- (A & C) or qPCR-method (B & D) was applied. Residual percent RNA synthesis was calculated by relating to the RNA amount in the positive control reactions. Bars show the standard deviation of the duplicate samples.

Similar articles

Cited by

References

    1. Adamson TE, Shore SM, Price DH. Analysis of RNA polymerase II elongation in vitro. Methods Enzymol. 2003;371:264–275. - PubMed
    1. Cheng B, Price DH. Isolation and functional analysis of RNA polymerase II elongation complexes. Methods. 2009;48:346–352. doi: 10.1016/j.ymeth.2009.02.026. - DOI - PMC - PubMed
    1. Rippe RA, Stefanovic B. Methods for assessing the molecular mechanisms controlling gene regulation. Methods Mol Med. 2005;117:141–160. - PubMed
    1. Derheimer FA, Chang C-W, Ljungman M. Transcription inhibition: a potential strategy for cancer therapeutics. Eur J Cancer. 2005;41:2569–2576. doi: 10.1016/j.ejca.2005.08.012. - DOI - PubMed
    1. Ljungman M, Lane DP. Transcription - guarding the genome by sensing DNA damage. Nat Rev Cancer. 2004;4:727–737. doi: 10.1038/nrc1435. - DOI - PubMed

MeSH terms