. 2014 Mar 26;34(13):4466-80.
doi: 10.1523/JNEUROSCI.4314-13.2014.

Conditional ablation of raptor or rictor has differential impact on oligodendrocyte differentiation and CNS myelination

Affiliations

Conditional ablation of raptor or rictor has differential impact on oligodendrocyte differentiation and CNS myelination

Kathryn K Bercury et al. J Neurosci. .

Abstract

During CNS development, oligodendrocytes, the myelinating glia of the CNS, progress through multiple transitory stages before terminating into fully mature cells. Oligodendrocyte differentiation and myelination is a tightly regulated process requiring extracellular signals to converge to elicit specific translational and transcriptional changes. Our lab has previously shown that the protein kinases, Akt and mammalian Target of Rapamycin (mTOR), are important regulators of CNS myelination in vivo. mTOR functions through two distinct complexes, mTOR complex 1 (mTORC1) and mTORC2, by binding to either Raptor or Rictor, respectively. To establish whether the impact of mTOR on CNS myelination results from unique functions of mTORC1 or mTORC2 during CNS myelination, we conditionally ablated either Raptor or Rictor in the oligodendrocyte lineage, in vivo. We show that Raptor (mTORC1) is a positive regulator of developmental CNS mouse myelination when mTORC2 is functional, whereas Rictor (mTORC2) ablation has a modest positive effect on oligodendrocyte differentiation, and very little effect on myelination, when mTORC1 is functional. Also, we show that loss of Raptor in oligodendrocytes results in differential dysmyelination in specific areas of the CNS, with the greatest impact on spinal cord myelination.

Keywords: Raptor; Rictor; mTOR; oligodendrocyte.


Figures

Figure 1.
Figure 1.
Ablation of Raptor in spinal cord oligodendrocytes resulted in selective decreases in myelin proteins and RNA during oligodendrocyte development. A, B, Representative Western blot (A) and quantification (B) of myelin proteins from P14 (left) and P29 (right) spinal cord lysates of control floxed Raptor (fl/fl) and Raptor cKO (cKO) animals. Quantification by Odyssey analysis of n ≥ 3 blots from n ≥ 3 animals per group. C, qPCR analysis of myelin protein RNAs from P14 (left) and P29 (right) whole spinal cord lysates. Each value represents duplicate samples from n = 6 animals. Control animal values are set to 100% based on averaging the actual numerical values, and the Raptor cKO values are graphed as a percentage of control. Values are displayed as ±SEM (*p < 0.05, **p < 0.005, ***p < 0.001, ****p < 0.0001).
Figure 2.
Figure 2.
Ablation of Raptor in corpus callosum oligodendrocytes resulted in selective decreases in myelin proteins RNAs. A, B, Western blot analysis and quantification of P14 (left) and P29 (right) oligodendrocyte-enriched corpus callosum lysates. Quantification by Odyssey analysis of n ≥ 3 blots from n = 3 animals. C, qPCR quantification of myelin RNAs at P14 (left) and P29 (right) in oligodendrocyte-enriched corpus callosum RNA samples. Each value represents duplicate samples from n = 6 animals. Values are expressed as ±SEM (*p < 0.05, **p < 0.005, ***p < 0.001, ****p < 0.0001).
Figure 3.
Figure 3.
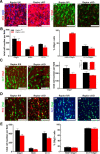
Ablation of Raptor in spinal cord oligodendrocytes resulted in delayed maturation. P14 and P29 spinal cord sections were analyzed for total oligodendrocytes, OPCs, and mature oligodendrocytes. OPCs: representative image (A, left) and quantification (B) of total oligodendrocytes (Olig2: blue) or OPCs (NG2:red) in the P14 cervical dorsal columns of Raptorfl/fl (black) and Raptor cKO (red) mice. Mature oligodendrocytes: comparable P14 sections (A, right) were also stained for total oligodendrocytes (Olig2:red) and mature oligodendrocytes (CC1:green). Quantification was from n ≥ 3 sections from n ≥ 3 animals. The left graph (B) represents the total number of Olig2-, NG2-, or CC1-positive cells per field. The right graph is the percentage of the total Olig2-positive cells that double labeled for NG2 or CC1. Since a small number of either NG2-positive or CC1-positive cells did not also express Olig2, they were not included in this quantification. C, P29 spinal cord sections were stained for Olig2 (red, all oligodendrocyte lineage cells) and CC1 (green, mature oligodendrocytes). Representative image (left) and quantification (right) of total oligodendrocytes and mature oligodendrocytes in the cervical dorsal columns of P29 Raptorfl/fl and Raptor cKO mice. The main graph represents the total number of Olig2-positive or CC1-positive cells. The inset graph demonstrated that the percentage of the total Olig2-positive cells that double labeled for CC1 was normal. Since a small number of CC1-positive cells did not also express Olig2, they were not included in this quantification. D, Representative images of 2 month (2M) Raptor cKO and Raptorfl/fl controls stained with NG2 (red), CC1 (blue), or Olig2 (green; top). E, Quantification showed that the total number of Olig2-positive cells and CC1-positive cells was significantly decreased in the Raptor cKO animals (bottom left), but the percentage of CC1 or NG2-positive/ Olig2-positive cells was not significantly different in the Raptor cKO animals compared with the control (bottom right). Quantification was from n ≥ 3 sections from n ≥ 3 animals. Scale bars, 50 μm. Values displayed as ±SEM (n = 4, *p < 0.05, **p < 0.005, ***p < 0.001).
Figure 4.
Figure 4.
Ablation of Raptor in corpus callosum oligodendrocytes resulted in reduced oligodendrocyte number and delayed maturation. A, P14 corpus callosum sections were stained for Olig2 (red, all oligodendrocyte lineage cells) and PDGFRα (green, OPCs). Top is a representative image of the series that were quantified for total oligodendrocytes or OPCs in the P14 Raptorfl/fl (black) and Raptor cKO (red) animals. The left graph represents the total number of Olig2-positive or PDGFRα-positive cells. The right graph is the percentage of the total Olig2-positive cells that double labeled for PDGFRα. Since a small number of PDGFRα-positive cells did not also express Olig2, they were not included in this quantification. Quantification was from n ≥ 3 sections from n ≥ 3 animals. B, P29 spinal cord sections were stained for Olig2 (red, all oligodendrocyte lineage cells) and CC1 (green, mature oligodendrocytes). Representative image (top) and quantification (lower graph) of total oligodendrocytes and mature oligodendrocytes in the corpus callosum of P29 control Raptorfl/fl and Raptor cKO animals. The left graph represents the total number of Olig2-, or CC1-positive cells. The right graph is the percentage of the total Olig2-positive cells that double labeled for CC1. Since a small number of CC1-positive cells did not also express Olig2, they were not included in this quantification. C, Representative images of 2 month (2M) Raptor control and Raptor cKO corpus callosum stained with PDGFRα (green), CC1 (blue), and Olig2 (red; top). D, Quantification of total Olig2-, PDGFRα-, and CC1-positive cells showed a reduction, but was not significantly reduced. Quantification was from n ≥ 3 sections from n ≥ 3 animals. Scale bars, 50 μm. Values displayed as ±SEM (*p < 0.05, **p < 0.005).
Figure 5.
Figure 5.
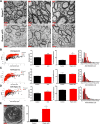
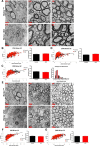
Myelin sheath thickness was reduced in the spinal cord of Raptor cKO animals. Electron micrographs from the dorsal column of the cervical enlargement of P14 (left), P29 (middle), and 2 month (2M; right) spinal cords of control floxed Raptor (top) or Raptor cKO (bottom) animals (A). Scatter plot and quantification of the g-ratio of the P14 (B), P29 (C), and 2 month (2MO; D) spinal cords of the floxed Raptor and Raptor cKO animals. On scatter plots (B–D, graph 1) black squares represent control samples; red squares represent cKO samples. Note increased g-ratio at P14 and 2 months (B, D; graph 2). Note increased numbers of unmyelinated axons at P14, which approaches control values with development (B–D, graph 3). The size distribution of myelinated axons was quantified and shown to be statistically significantly different (B–D, graph 4). Significant dysmyelination of large caliber axons was noted at P29 (E), which prevented an accurate g-ratio measurement for the P29 time point, where few large diameter axons could be analyzed for g-ratio (C, scatter plot, red squares). Large caliber axons with uncompacted myelin (dysmyelinated) at P29 were quantified (E, graph). The dysmyelination noted at P29 was not seen at 2 months of age, but compacted myelin was thinner than control. Scale bars: A, low-magnification images, 1 μm; E, high-magnification representation of the myelin sheath, 100 nm. Values are displayed as ±SEM (n = 3, *p < 0.05, **p < 0.005).
Figure 6.
Figure 6.
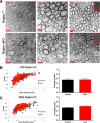
In contrast to spinal cord, in Raptor cKO corpus callosum, myelin sheath compaction was relatively normal. A, Electron micrographs in the corpus callosum of floxed Raptor (black) and Raptor cKO (red) mice at P14 (initiation of myelination), P29 (peak of active myelination), and 2 month (2M; myelin maintenance phase). B, Quantification of the g-ratio as a scatter plot with axonal diameter on the x-axis and the g-ratio on the y-axis for the P29 and 2 month floxed Raptor and Raptor cKO animals (B, C). At P14, there were few myelinated axons (large caliber) in either group. Note high-magnification images of myelin at P29, where there were subtle deficits in myelin compaction in the Raptor cKO mice, but there is not an overall reduction in myelin sheath thickness. At 2 months (2MO), the axonal caliber and myelin thickness was comparable between Raptorfl/fl and Raptor cKO mice (C). Scale bars: A, low-magnification images, 1 μm; high-magnification image insets, 100 nm. Values displayed as ±SEM (n = 3, *p < 0.05, **p < 0.005, ***p < 0.001).
Figure 7.
Figure 7.
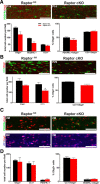
Loss of mTORC2 had less impact on oligodendrocyte development than loss of mTORC1. Representative Western blot (A) and quantification (B) of PLP, MBP, MOG, CNP, and MAG protein from P14 (B, left graph) and P29 (B, right graph) lysates isolated from whole spinal cord lysates of floxed Rictor (black) and Rictor cKO (red) animals. C, qPCR analysis RNA from whole spinal cord lysates from P14 and P29 floxed Rictor (black) and Rictor cKO (red) animals for myelin RNAs. D, Representative immunohistochemically stained sections (Olig2, blue; NG2, red; left) and quantification (right graphs) of cells in the dorsal columns of P14 Rictorfl/fl and Rictor cKO animals. The left graph represents the total number of Olig2-, NG2-, or CC1-positive cells. The right graph is the percentage of the total Olig2-positive cells that double labeled for NG2 or CC1. Since a small number of NG2-positive cells did not also express Olig2, they were not included in this quantification. E, Representative immunohistochemically stained sections (Olig2, red; CC1, green; left) and quantification (right graphs) of mature oligodendrocytes in the dorsal columns of P29 Rictorfl/fl and Rictor cKO spinal cord. The left graph represents the total number of Olig2-positive or CC1-positive cells. The right graph is the percentage of the total Olig2-positive cells that double labeled for CC1. Since a small number of CC1-positive cells did not also express Olig2, they were not included in this quantification. Scale bars, 75 μm. Values are displayed as ±SEM (n ≥ 3, *p < 0.05, **p < 0.005, ***p < 0.001, ****p < 0.0001).
Figure 8.
Figure 8.
Selective myelin proteins and RNAs were impacted in the corpus callosum of Rictor cKO mice. Representative Western blots (A) and quantification (B) of myelin proteins from P14 (B, left graph) and P29 (B, right graph) oligodendrocyte-enriched corpus callosum lysates. qPCR analysis of the transcriptional profile for myelin RNAS in P14 (C, left graph) and P29 (C, right graph) corpus callosum lysates from Rictor cKO and control animals. D, Representative immunohistochemically stained sections (Olig2, red; PDGFRα, green; top) and quantification (lower graph) of cells in the corpus callosum of P14 floxed Rictor (black) and Rictor cKO (red) animals. The main graph represents the total number of Olig2-positive or PDGFRα-positive cells. E, Representative immunohistochemically stained sections (Olig2, red; CC1, green; top) and quantification (lower graphs) of cells in the corpus callosum of P29 Rictorfl/fl and Rictor cKO animals. The main graph represents the total number of Olig2-positive or CC1-positive cells. Scale bars, 200 μm. Values are displayed as ±SEM (n ≥ 3, *p < 0.05, **p < 0.005, ***p < 0.001, ****p < 0.0001).
Figure 9.
Figure 9.
The ultrastructure of the myelin sheath was unperturbed when Rictor was ablated in the oligodendrocytes in spinal cord or corpus callosum. A, Electron micrographs of the dorsal columns (P14, left; P29, middle; 2 months (2M), right) cervical enlargements of the spinal cord. Quantification of the g-ratio of P14 (B), P29 (C), and 2month (2MO) tissue (D). Note that at P29 there is a significant increase in the frequency of small caliber axons in the Rictor cKO compared with control animals. Note no change in g-ratio at any age (bottom). E, Electron micrographs of P14, P29, and 2M tissue at the midline of the corpus callosum of floxed Rictor (black) and Rictor cKO (red) animals. F, G, Quantification of the g-ratio of P29 and 2MO. Scale bar, 1 μm. Values are displayed as ±SEM (n = 3).
Figure 10.
Figure 10.
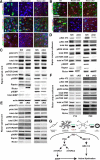
Signaling changes in Raptor and Rictor cKO CNS. Immunohistochemical localization of signaling proteins in oligodendrocytes in P14 (A) and P29 (B) spinal cord sections of floxed control (left), Raptor cKO (middle), and Rictor cKO (right) mice. Sections were analyzed for expression of pS6RP, pERK, or pRaptor in CC1-, Olig2-, or Sox10-positive cells (A, B). Representative Western blots of whole spinal cord or corpus callosum-enriched lysates of P14 and P29 Raptor (C, D) or Rictor (E, F) cKO mice. For significance of signaling proteins that were unchanged from controls or that were significantly decreased, see Tables 3, 4. Schematic of a proposed model for signaling mechanisms regulating myelination within the oligodendrocyte lineage (G). Scale bars: A, B, 50 μm.

Similar articles

Cited by

References

    1. Ainger K, Avossa D, Morgan F, Hill SJ, Barry C, Barbarese E, Carson JH. Transport and localization of exogenous myelin basic protein mRNA microinjected into oligodendrocytes. J Cell Biol. 1993;123:431–441. doi: 10.1083/jcb.123.2.431. - DOI - PMC - PubMed
    1. Ainger K, Avossa D, Diana AS, Barry C, Barbarese E, Carson JH. Transport and localization elements in myelin basic protein mRNA. J Cell Biol. 1997;138:1077–1087. doi: 10.1083/jcb.138.5.1077. - DOI - PMC - PubMed
    1. Bentzinger CF, Romanino K, Cloëtta D, Lin S, Mascarenhas JB, Oliveri F, Xia J, Casanova E, Costa CF, Brink M, Zorzato F, Hall MN, Rüegg MA. Skeletal muscle-specific ablation of raptor, but not of rictor, causes metabolic changes and results in muscle dystrophy. Cell Metab. 2008;8:411–424. doi: 10.1016/j.cmet.2008.10.002. - DOI - PubMed
    1. Brown EJ, Albers MW, Shin TB, Ichikawa K, Keith CT, Lane WS, Schreiber SL. A mammalian protein targeted by G1-arresting rapamycin-receptor complex. Nature. 1994;369:756–758. doi: 10.1038/369756a0. - DOI - PubMed
    1. Carson JH, Worboys K, Ainger K, Barbarese E. Translocation of myelin basic protein mRNA in oligodendrocytes requires microtubules and kinesin. Cell Motil Cytoskeleton. 1997;38:318–328. doi: 10.1002/(SICI)1097-0169(1997)38:4<318::AID-CM2>3.3.CO%3B2-C. - DOI - PubMed

Publication types

MeSH terms

Substances

LinkOut - more resources