. 2014 May;124(5):2076-86.
doi: 10.1172/JCI71194. Epub 2014 Mar 25.

Sphingosine-1-phosphate receptor 1 reporter mice reveal receptor activation sites in vivo

Sphingosine-1-phosphate receptor 1 reporter mice reveal receptor activation sites in vivo

Mari Kono et al. J Clin Invest. 2014 May.

Abstract

Activation of the GPCR sphingosine-1-phosphate receptor 1 (S1P1) by sphingosine-1-phosphate (S1P) regulates key physiological processes. S1P1 activation also has been implicated in pathologic processes, including autoimmunity and inflammation; however, the in vivo sites of S1P1 activation under normal and disease conditions are unclear. Here, we describe the development of a mouse model that allows in vivo evaluation of S1P1 activation. These mice, known as S1P1 GFP signaling mice, produce a S1P1 fusion protein containing a transcription factor linked by a protease cleavage site at the C terminus as well as a β-arrestin/protease fusion protein. Activated S1P1 recruits the β-arrestin/protease, resulting in the release of the transcription factor, which stimulates the expression of a GFP reporter gene. Under normal conditions, S1P1 was activated in endothelial cells of lymphoid tissues and in cells in the marginal zone of the spleen, while administration of an S1P1 agonist promoted S1P1 activation in endothelial cells and hepatocytes. In S1P1 GFP signaling mice, LPS-mediated systemic inflammation activated S1P1 in endothelial cells and hepatocytes via hematopoietically derived S1P. These data demonstrate that S1P1 GFP signaling mice can be used to evaluate S1P1 activation and S1P1-active compounds in vivo. Furthermore, this strategy could be potentially applied to any GPCR to identify sites of receptor activation during normal physiology and disease.


Figures

Figure 1
Figure 1. Generation of S1P1 GFP signaling reporter mice.
(A) Schematic of the “Tango” design to monitor S1P1-β-arrestin interactions. Ligand activation of GPCRs leads to their phosphorylation and subsequent recognition by arrestins. The target GPCR, in this case S1P1, is modified by linking the tetracycline-controlled transactivator (tTA) to its C terminus through a TEV protease recognition sequence (tevs). Ligand binding to the receptor stimulates the recruitment of a β-arrestin-TEV protease fusion protein, triggering the release of tTA from the C terminus of modified S1P1. Free tTA enters the nucleus and stimulates histone H2B-GFP reporter gene activity. (B) Design of the S1pr1 knockin vector. Coding sequences for the 2 fusion proteins, S1P1-tTA and mouse β-arrestin-2-TEV (mArrb2-TEV) protease, connected by an IRES, were included along with the neomycin resistance gene (NeoR) flanked by loxP sites. This knockin segment was flanked by 2.4 kb of 5′ and 3.8 kb of homologous 3′ genomic sequences adjacent to the second exon of S1pr1. The herpes simplex virus thymidine kinase (TK) gene was added outside of the homologous sequence to minimize random integration. Schematics of the targeting vector, WT S1pr1 allele, and S1pr1 knockin allele are shown. PA, polyadenylation sequence. (C) Mouse mating scheme to obtain S1P1 GFP signaling (S1P1GS) mice. S1pr1 knockin mice were crossed with histone-EGFP reporter (H2B-GFP) mice, in which human histone 1 protein H2bj and EGFP fusion protein are expressed under the control of a tetracycline-responsive promoter element and cytomegalovirus minimal promoter.
Figure 2
Figure 2. S1P1 activation in MEFs.
(A) Validation of modified S1P1 signaling pathway in MEFs. S1P1 GFP signaling MEFs were cultured for 16 hours in medium containing 10% charcoal-stripped FBS and received either S1P (10–7 M) or vehicle (4 mg/ml BSA in PBS). Nuclei were stained with Hoechst, and MEF cultures were imaged under an inverted laser-scanning confocal microscope. The experiment was repeated twice in duplicate, and a representative result is shown. (B) Treatment of MEFs with RP-001. S1P1 GFP signaling MEFs were cultured for 16 hours in medium containing 10% charcoal-stripped FBS and received either S1P or RP-001. After 24 hours, nuclei were stained with Hoechst, and MEF cultures were imaged under an inverted laser-scanning confocal microscope. The experiment was performed in duplicate, and a representative result is shown. (C) Flow cytometry analysis of S1P1 GFP signaling MEFs. S1P1 GFP signaling MEFs were cultured for 16 hours in medium containing 10% charcoal-stripped FBS and various concentrations of S1P were added. After 24 hours, the number of GFP+ cells was determined by flow cytometry. The experiment was repeated twice. Data represent mean ± SEM (n = 3). (D) Endogenous S1P1 signaling pathway in MEFs. S1P1 GFP signaling MEFs were cultured for 16 hours in medium containing 0.1% FBS and received 1 μM of S1P1 receptor ligands (RP-001, S1P, or SEW2871) or vehicle (4 mg/ml BSA in PBS). After 10 minutes, the cell lysate was harvested and then Akt and phospho-Akt were identified by Western blotting (see complete unedited blot in the supplemental material). The experiment was performed in triplicate, and a representative result is shown. Scale bars: 100 μm.
Figure 3
Figure 3. S1P1 activation in embryos.
S1P1 GFP signaling and H2B-GFP E9.5 and E10.5 mouse embryos were imaged using a fluorescence stereomicroscope. TC, telencephalon; HT, heart; DA, dorsal aorta. Four litters each of E9.5 and E10.5 embryos were examined.
Figure 4
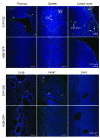
Figure 4. S1P1 activation in tissues.
Histological sections from S1P1 GFP signaling and H2B-GFP mice were stained with DAPI, and the images were captured with an inverted laser-scanning confocal microscope. Small arrowheads point to GFP+ vascular structures. The tissues of 5 mice for each genotype were examined. CA, central arteries; HEV, high endothelial venules; MS, medullary sinuses; SS, subcapsular sinuses. Scale bars: 100 μm.
Figure 5
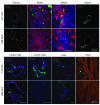
Figure 5. Identification of cell type–specific S1P1 activation.
Histological sections from S1P1 GFP signaling and H2B-GFP mice were immunostained with antibodies to CD31, PNAd, LYVE-1, B220, and MARCO, and the images were captured with an inverted laser-scanning confocal microscope. Scale bars: 50 μm.
Figure 6
Figure 6. FTY720 induced activation of S1P1 in endothelial cells and hepatocytes.
FTY720 (1 mg/kg) or vehicle (ethanol/PBS, 1:1) was intraperitoneally injected into S1P1 GFP signaling mice, and the tissues were harvested 1 day after injection. Histological sections were immunostained with antibodies to CD31, LYVE-1, or albumin, and the images were captured using an inverted laser-scanning confocal microscope. The tissues of 3 mice for each treatment were examined. Scale bars: 50 μm.
Figure 7
Figure 7. S1P1 activation in endothelial cells and hepatocytes during systemic inflammation.
LPS (20 mg/kg) or vehicle (PBS) was injected intraperitoneally into S1P1 GFP signaling mice, and the tissues were harvested 3 days after injection. Histological sections were immunostained with antibodies to CD31, LYVE-1, or albumin, and the images were captured using an inverted laser-scanning confocal microscope. The tissues of 4 mice injected with LPS and 3 mice injected with vehicle were examined. Scale bars: 50 μm.
Figure 8
Figure 8. S1P1 activation by hematopoietically derived S1P during systemic inflammation.
(A) Experimental scheme. Bone marrow cells from pS1Pless or control mice were transplanted into S1P1 GFP signaling mice. Ten weeks later, plasma sphingolipid levels were determined; in addition, LPS (20 mg/kg) or vehicle (PBS) was injected intraperitoneally into the mice. After 24 hours, cells were isolated from the lungs and livers, and the percentages of GFP+ cells in CD31+ or CD95+ populations were quantified by flow cytometry. (B) Quantification of dihydrosphingosine (dhSph), sphingosine (Sph), dhS1P, and S1P by HPLC-tandem mass spectrometry in plasma of bone marrow–transplanted mice. Bars represent mean ± SEM (n = 3 for each genotype). (CE) Flow cytometry analysis was used to determine the percentage of GFP+ cells in the (C) lung CD45 CD31+ population, (D) liver CD31+ population, and (E) CD95+ population 24 hours after LPS or vehicle injection. Bars represent mean ± SEM (n = 7 for vehicle-injected control bone marrow transplant mice and n = 8 for the other 3 groups in C; n = 3 for LPS-injected control bone marrow transplant mice and n = 4 for the other 3 groups in D and E). Student’s t test; *P < 0.05, **P < 0.01, ***P < 0.001.

Similar articles

Cited by

References

    1. Takabe K, Paugh SW, Milstien S, Spiegel S. “Inside-out” signaling of sphingosine-1-phosphate: therapeutic targets. Pharmacol Rev. 2008;60(2):181–195. doi: 10.1124/pr.107.07113. - DOI - PMC - PubMed
    1. Blaho VA, Hla T. Regulation of mammalian physiology, development, and disease by the sphingosine 1-phosphate and lysophosphatidic acid receptors. Chem Rev. 2011;111(10):6299–6320. doi: 10.1021/cr200273u. - DOI - PMC - PubMed
    1. Rosen H, Stevens RC, Hanson M, Roberts E, Oldstone MB. Sphingosine-1-phosphate and its receptors: structure, signaling, and influence. Annu Rev Biochem. 2013;82:637–662. doi: 10.1146/annurev-biochem-062411-130916. - DOI - PubMed
    1. Chae SS, Proia RL, Hla T. Constitutive expression of the S1P1 receptor in adult tissues. Prostaglandins Other Lipid Mediat. 2004;73(1–2):141–150. doi: 10.1016/j.prostaglandins.2004.01.006. - DOI - PubMed
    1. Regard JB, Sato IT, Coughlin SR. Anatomical profiling of G protein-coupled receptor expression. Cell. 2008;135(3):561–571. doi: 10.1016/j.cell.2008.08.040. - DOI - PMC - PubMed

Publication types

MeSH terms