. 2014 Jun;196(11):2053-66.
doi: 10.1128/JB.01370-13. Epub 2014 Mar 21.

The highly conserved MraZ protein is a transcriptional regulator in Escherichia coli

Affiliations

The highly conserved MraZ protein is a transcriptional regulator in Escherichia coli

Jesus M Eraso et al. J Bacteriol. 2014 Jun.

Abstract

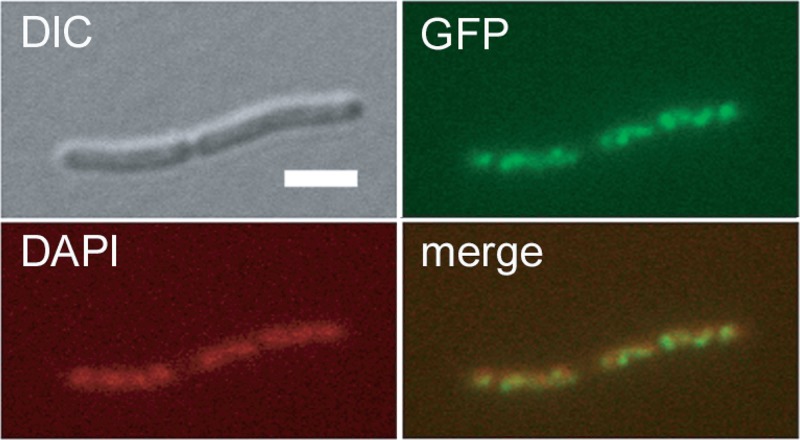
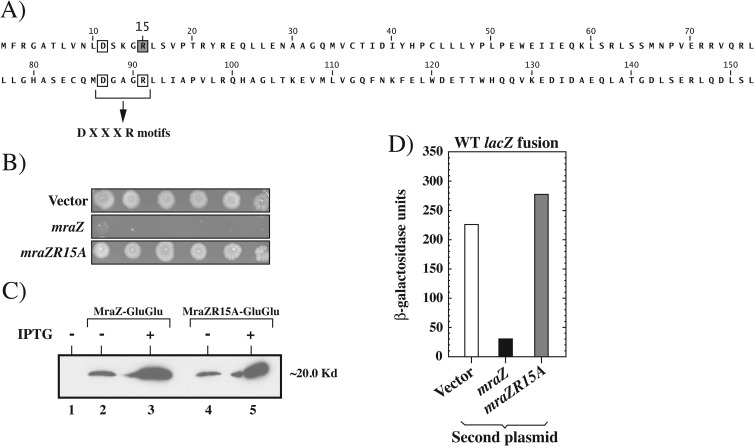
The mraZ and mraW genes are highly conserved in bacteria, both in sequence and in their position at the head of the division and cell wall (dcw) gene cluster. Located directly upstream of the mraZ gene, the Pmra promoter drives the transcription of mraZ and mraW, as well as many essential cell division and cell wall genes, but no regulator of Pmra has been found to date. Although MraZ has structural similarity to the AbrB transition state regulator and the MazE antitoxin and MraW is known to methylate the 16S rRNA, mraZ and mraW null mutants have no detectable phenotypes. Here we show that overproduction of Escherichia coli MraZ inhibited cell division and was lethal in rich medium at high induction levels and in minimal medium at low induction levels. Co-overproduction of MraW suppressed MraZ toxicity, and loss of MraW enhanced MraZ toxicity, suggesting that MraZ and MraW have antagonistic functions. MraZ-green fluorescent protein localized to the nucleoid, suggesting that it binds DNA. Consistent with this idea, purified MraZ directly bound a region of DNA containing three direct repeats between Pmra and the mraZ gene. Excess MraZ reduced the expression of an mraZ-lacZ reporter, suggesting that MraZ acts as a repressor of Pmra, whereas a DNA-binding mutant form of MraZ failed to repress expression. Transcriptome sequencing (RNA-seq) analysis suggested that MraZ also regulates the expression of genes outside the dcw cluster. In support of this, purified MraZ could directly bind to a putative operator site upstream of mioC, one of the repressed genes identified by RNA-seq.


Figures

FIG 1
FIG 1
Physiological effects of deletion and overexpression of the mraZ gene. (A) The dcw cluster of E. coli, showing the location of the Pmra promoter upstream of mraZ and highlighting the position of mraZ and mraW at the beginning of the cluster. (B) Spot dilution assay of WT and mraZ and mraW overexpressing MG1655 cells on LB plates containing 0.1 μg/ml trimethoprim. Shown from left to right are undiluted and 10−1 to 10−5 diluted samples of a mid-logarithmic-phase culture grown in LB with no antibiotic. (C) Spot dilution assay of WT and mraZ and mraW mutant MG1655 on LB plates containing 1 mM IPTG to fully induce gene expression. Shown from left to right are undiluted and 10−1 to 10−5 diluted samples of a mid-logarithmic-phase culture grown in LB with no induction. (D) Growth curves of the same strains as in panel B either uninduced or induced with 1 mM IPTG. V, vector.
FIG 2
FIG 2
Antagonistic effect of MraW on MraZ. (A) Spot dilution assay of WT MG1655 containing the pDSW208 vector alone, pDSW208-mraZ, or pDSW208-mraZ-mraW on LB plates containing 1 mM IPTG to fully induce gene expression. Shown from left to right are undiluted and 10−1 to 10−5 diluted samples of a mid-logarithmic-phase culture grown in LB with no induction. (B) Growth curves of WT MG1655 and the mraW null mutant in LB without IPTG containing either the pDSW208 vector alone (V) or pDSW208-mraZ.
FIG 3
FIG 3
MraZ localizes to the nucleoid. WT MG1655 containing an mraZ-gfp fusion in pDSW208 was grown in LB to an OD600 of ∼0.2 with no IPTG induction. Cells were moderately inhibited for septation even under these uninduced conditions because of leaky expression from the plasmid trc promoter. Differential interference contrast (DIC), DAPI-stained, MraZ-GFP fluorescence, and merged DAPI-GFP images of a representative dividing filament are shown (scale bar, 3 μm).
FIG 4
FIG 4
Negative autoregulation by MraZ. (A) The DNA sequence of the mraZ regulatory region is shown, highlighting Pmra and the OWT sequence, TGGGN-N5-TGGGN-N5-TGGGN. DR1, DR2, and DR3 represent the three DRs separated by the 5-nt spacer regions. (B) β-Galactosidase assays with the WT mraZ-lacZ fusion. WT MG1655 cells carrying a pDSW208 plasmid with no insert (vector) or expressing mraZ, mraW, or both mraZ and mraW were assayed for expression of the mraZ-lacZ reporter on a compatible plasmid (pJE6618). β-Galactosidase activity is expressed in μmol/min/mg protein. Standard deviations were ≤15%. (C) Four different mutant Pmra operator sites are shown. Asterisks indicate the mutagenized DRs. The mutations in the DRs are underlined. (D) Comparison of the β-galactosidase activities of the WT mraZ-lacZ reporter or mutant mraZ-lacZ (O1 to O4) reporters regulated by expression from pDSW208 (vector) or (pDSW208/mraZ). Cells were induced with 50 μM IPTG for 30 min. β-Galactosidase activity is expressed in μmol/min/mg protein. One representative experiment is shown.
FIG 5
FIG 5
Characterization of the MraZR15A DNA-binding mutant. (A) Sequence of the MraZ protein from E. coli, representing the two copies of the UPF0040 fold (19), including amino acids 1 to 76 (top row) and 77 to 152 (bottom row). The two DXXXR motifs are highlighted; they correspond to amino acids D11 to R15 and D87 to R91. Arginine R15 (shaded square) in the first motif was mutated to alanine in the MraZR15A mutant. (B) Spot dilution assay of WT MG1655 containing the pDSW208 vector, pDSW208-mraZ, or pDSW208-mraZR15A on LB plates containing 1 mM IPTG to fully induce gene expression. (C) Levels of MraZR15A are similar to those of MraZ. WT MG1655 cells containing the pDSW208 vector (lane 1), pDSW208-mraZ-gluglu (lanes 2 and 3), or pDSW208-mraZR15A-gluglu (lanes 4 and 5) were grown in LB to an OD600 of ∼0.2. Cells expressing mraZ on the plasmid were either left uninduced (lanes 2 and 4) or induced (lanes 3 and 5) with 1 mM IPTG and grown for an additional 2 h. Aliquots were normalized for total protein and subjected to SDS-PAGE. Blots were detected with anti-GluGlu antibodies. The location of 20 Kd is where the 20-kDa molecular size marker runs. (D) β-Galactosidase assays comparing the effects of pDSW208 (vector), (pDSW208/mraZ), and (pDSW208/mraZR15A) on the mraZ-lacZ reporter after induction with 50 μM IPTG for 30 min. β-Galactosidase activity is expressed in μmol/min/mg protein. One representative experiment is shown.
FIG 6
FIG 6
Binding of MraZ to the mraZ regulatory region. (A) Binding of increasing concentrations of WT MraZ to biotinylated OWT in EMSAs. About 0.3 pmol of a biotinylated 240-bp fragment containing the mraZ regulatory region was incubated with 3.2 (lane 2), 6.4 (lane 3), 10.7 (lane 4), 32 (lane 5), or 96 (lane 6) pmol of MraZ protein. The components in lane 7 were similar to those in lane 6, with the addition of an approximately 8× molar excess of unlabeled mraZ DNA. Lane 1 is biotinylated mraZ DNA alone. Complexes 1 and 2 are the two specific complexes observed. (B) Binding of increasing concentrations of mutant MraZR15A to biotinylated OWT. The protein concentrations were similar to those in panel A. Lane 1 is biotinylated mraZ DNA alone. (C) Binding of MraZ to WT (OWT) and mutant (O1 to O4) operators. About 0.3 pmol of a labeled double-stranded 240-bp fragment containing OWT was incubated with ∼0.09 nmol of MraZ protein, equivalent to the amount of MraZ used in lane 6 of panel A (lane 2). The mutant operators were incubated similarly (O1, lane 4; O2, lane 6; O3, lane 8; O4, lane 10). The corresponding DNA-only lanes are as follows: OWT, lane 1; O1, lane 3; O2, lane 5; O3, lane 7; O4, lane 9. (D) Competition with unlabeled WT (OWT) and mutant (O1 to O4) operators. MraZ-OWT DNA complexes similar to those depicted in panel A, lane 6 (shown in lanes 1, 3, 5, 7, and 9), were competed with an approximately 8× molar excess of unlabeled WT (OWT, lane 2) and mutant (O1, lane 4; O2, lane 6; O3, lane 8; O4, lane 10) operators.
FIG 7
FIG 7
Gene expression analysis by RNA-seq. The numbers of genes activated (white columns) or repressed (black columns) by MraZ are shown; they were binned by the fold changes in their expression (top). These genes were selected as follows. First, only genes with an FDR of ≤0.05 were chosen; second, the cutoff for differential gene expression was set at a nonlogFC value of ≥2 (or ≥2-fold). (A) WT MG1655 and a mraZ mutant containing the pDSW208 vector were grown in LB to stationary phase (OD of ≥1.4). Cells were collected, and the total RNA was extracted and subjected to RNA-seq analysis. (B) WT MG1655 containing either the pDSW208 vector alone or carrying mraZ was grown in LB to early log phase (OD of ≤0.1) and induced with 50 μM IPTG for 30 min. Cells were collected, and total RNA was extracted and subject to RNA-seq analysis.
FIG 8
FIG 8
Binding of MraZ to the mioC regulatory region. (A) The DNA sequence of the mioC regulatory region is shown, including PmioC and the DnaA box (56). DR1 to DR3 represent the three DRs separated by 8- and 5-nt spacer regions. DR2 is 1 nt from the consensus TGGGN. (B) Binding of increasing concentrations of WT MraZ to biotinylated mioC. About 0.3 pmol of a biotinylated double-stranded 238-bp fragment containing the mioC regulatory region was incubated with 3.2 (lane 2), 6.4 (lane 3), 10.7 (lane 4), 32 (lane 5), or 96 (lane 6) pmol of MraZ protein. The components in lane 7 were the same as those in lane 6, with the addition of an approximately 10× molar excess of unlabeled mioC DNA. Lane 1 is biotinylated mioC DNA only.

Similar articles

Cited by

References

    1. Blasco B, Pisabarro AG, de Pedro MA. 1988. Peptidoglycan biosynthesis in stationary-phase cells of Escherichia coli. J. Bacteriol. 170:5224–5228 - PMC - PubMed
    1. Clark DJ. 1968. The regulation of DNA replication and cell division in E. coli B-r. Cold Spring Harbor Symp. Quant. Biol. 33:823–838. 10.1101/SQB.1968.033.01.094 - DOI - PubMed
    1. Lee YS, Han JS, Jeon Y, Hwang DS. 2001. The arc two-component signal transduction system inhibits in vitro Escherichia coli chromosomal initiation. J. Biol. Chem. 276:9917–9923. 10.1074/jbc.M008629200 - DOI - PubMed
    1. Loeb A, McGrath BE, Navre JM, Pierucci O. 1978. Cell division during nutritional upshifts of Escherichia coli. J. Bacteriol. 136:631–637 - PMC - PubMed
    1. Walker HH, Winslow CE, Mooney MG. 1934. Bacterial cell metabolism under anaerobic conditions. J. Gen. Physiol. 17:349–357. 10.1085/jgp.17.3.349 - DOI - PMC - PubMed

Publication types

LinkOut - more resources