. 2014 Mar 21;15(3):R52.
doi: 10.1186/gb-2014-15-3-r52.

Genomic occupancy of Runx2 with global expression profiling identifies a novel dimension to control of osteoblastogenesis

Genomic occupancy of Runx2 with global expression profiling identifies a novel dimension to control of osteoblastogenesis

Hai Wu et al. Genome Biol. .

Abstract

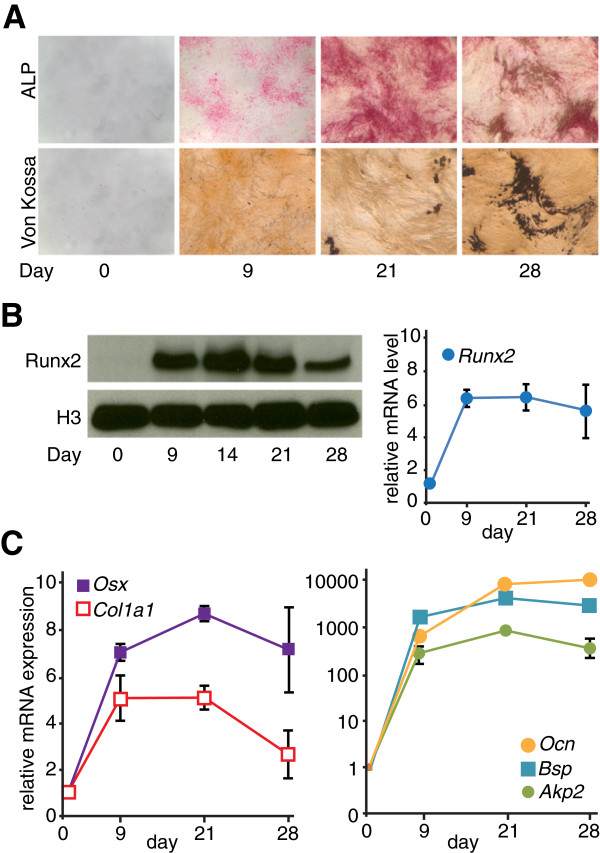
Background: Osteogenesis is a highly regulated developmental process and continues during the turnover and repair of mature bone. Runx2, the master regulator of osteoblastogenesis, directs a transcriptional program essential for bone formation through genetic and epigenetic mechanisms. While individual Runx2 gene targets have been identified, further insights into the broad spectrum of Runx2 functions required for osteogenesis are needed.

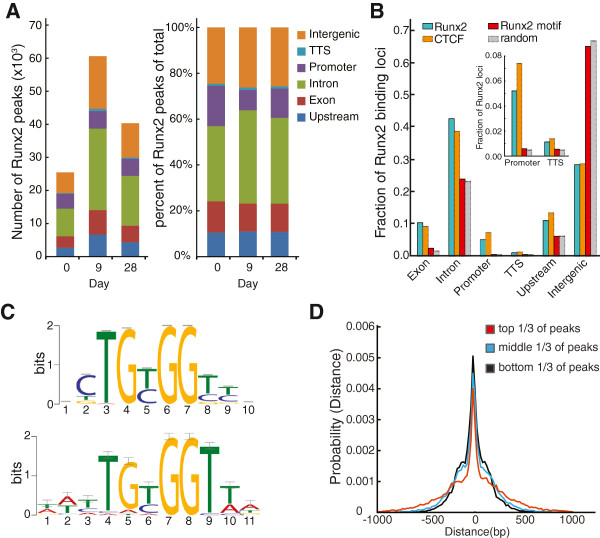
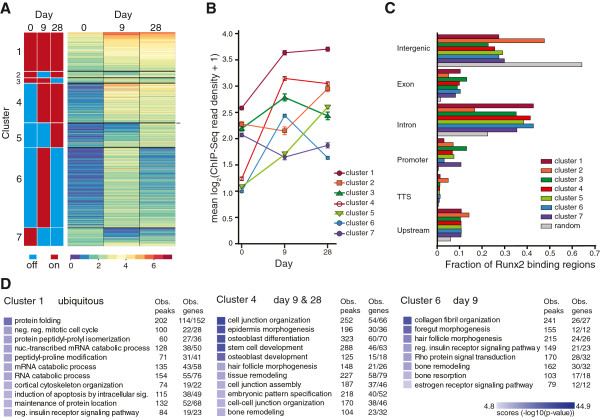
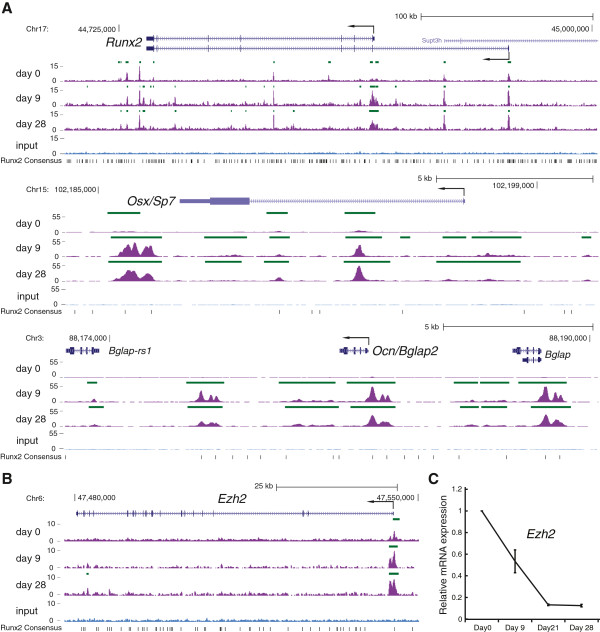
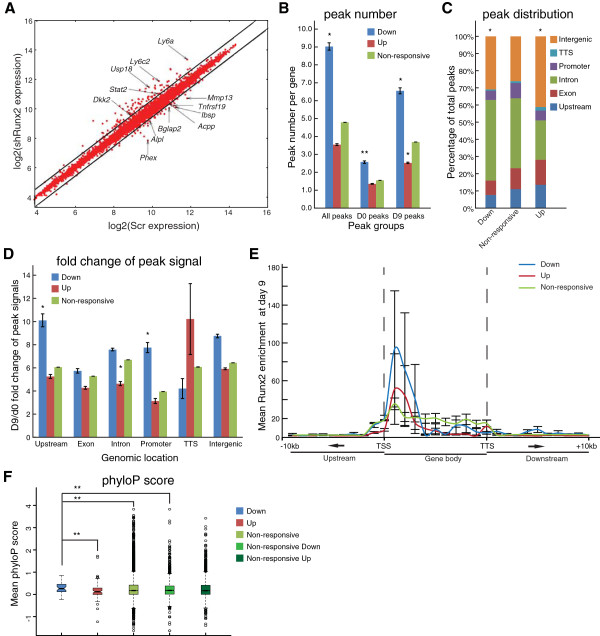
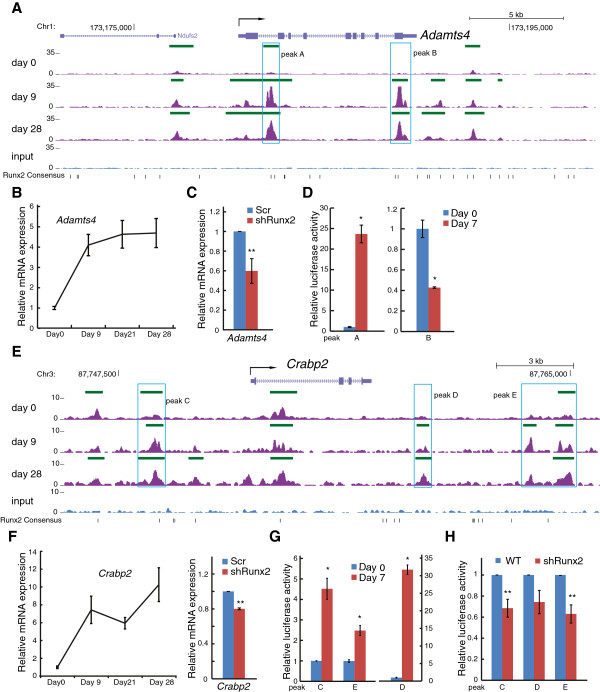
Results: By performing genome-wide characterization of Runx2 binding at the three major stages of osteoblast differentiation--proliferation, matrix deposition and mineralization--we identify Runx2-dependent regulatory networks driving bone formation. Using chromatin immunoprecipitation followed by high-throughput sequencing over the course of these stages, we identify approximately 80,000 significantly enriched regions of Runx2 binding throughout the mouse genome. These binding events exhibit distinct patterns during osteogenesis, and are associated with proximal promoters and also non-promoter regions: upstream, introns, exons, transcription termination site regions, and intergenic regions. These peaks were partitioned into clusters that are associated with genes in complex biological processes that support bone formation. Using Affymetrix expression profiling of differentiating osteoblasts depleted of Runx2, we identify novel Runx2 targets including Ezh2, a critical epigenetic regulator; Crabp2, a retinoic acid signaling component; Adamts4 and Tnfrsf19, two remodelers of the extracellular matrix. We demonstrate by luciferase assays that these novel biological targets are regulated by Runx2 occupancy at non-promoter regions.

Conclusions: Our data establish that Runx2 interactions with chromatin across the genome reveal novel genes, pathways and transcriptional mechanisms that contribute to the regulation of osteoblastogenesis.


Figures

Figure 1
Figure 1
The differentiation stages of murine MC3T3-E1 preosteoblasts used for profiling studies. (A) Staining for alkaline phosphatase (ALP) activity (upper panel) and mineralization (Von Kossa, lower panel) in MC3T3-E1 cells during three stages of differentiation: proliferation (day 0), matrix deposition (days 9 to 21), and mineralization (day 28). (B) Protein (left panel) and mRNA levels (right panel) of Runx2 during osteoblastic differentiation of MC3T3-E1 cells. Histone H3 (H3) was used as loading control for western blotting. (C) Expression profile of osteoblast-related markers Osx/Sp7, Col1a1 (left panel), Akp2/Alpl (alkaline phosphatase liver/bone/kidney), Bsp/Ibsp, and Ocn/Bglap2 (right panel) in MC3T3-E1 cells during differentiation. Relative mRNA levels (versus day 0) were determined by quantitative RT-PCR (reverse transcription PCR), normalized by Hprt1 mRNA levels and plotted as mean values ± SEM (standard error of mean) from three independent biological replicates. The expression levels of the genes in (B,C) at days 9, 21, and 28 were significantly upregulated when compared to those at day 0 (P < 0.05, t-test).
Figure 2
Figure 2
Genome-wide profile of Runx2 occupancy. (A) Distribution of Runx2 binding peaks across the mouse genome were classified into six categories of genomic locations: exon, intron, promoter (-1 kb to +150 bp of TSS), upstream (-1 kb to -20 kb from TSS), TTS region (-150 bp to -1 kb of transcription termination site), and intergenic region. Peak distribution was plotted at each time point by peak number (left panel) and by the percentage of total peaks (right panel). (B) Differential Runx2 enrichment in the six categories of genomic locations compared to the predicted Runx2 motif (see below), to random binding, or to binding of the transcription factor CTCF. Inset provides a magnified view of promoter and TTS regions. (C) The 500 most significant Runx2 peaks, based on MACS [22] significance (P < 1 × 10-10) were used for de novo motif discovery. A Runx2 motif (position weight matrix, top) with strong statistical confidence (P = 4.7 × 10-200) was determined using MEME (MEME suite version 4.7.0) [24]. The known Runx motif (MA0002.2, bottom) in JASPAR [26] was used for comparison using TOMTOM [24]. As shown in (B), the distribution of de novo Runx2 motifs among categories of genomic locations was determined using FIMO [24] at a significance threshold of P < 10-4. (D) Probability plot of the distribution of Runx2 peaks indicating the distances of Runx2 motifs to the peak centers in the top, middle, and bottom third of Runx2 peaks (ranked by MACS scores) versus the probabilities of finding de novo Runx2 motifs at given positions relative to peak center.
Figure 3
Figure 3
Characterization of the temporal patterns of Runx2 binding associated with osteoblastogenesis. (A) Enriched regions of Runx2 binding (MACS peaks, P ≤ 1 × 10-10) were grouped into seven clusters based on the presence (red) or absence (blue) of peaks at temporal stages of osteoblastic differentiation (left panel). In the right panel, each line illustrates intensity (base-2 logarithm of the sum of read counts per 10 million reads (mean read density)) of one peak as a range from strong occupancy (brown) to weak occupancy (violet). (B) Runx2 binding intensities of Runx2 peaks from each cluster at days 0, 9, and 28 of differentiation plotted as mean ± SEM. (C) Distribution patterns of the Runx2 peaks from each of the seven clusters (from (A)) segregated into six categories of genomic locations and compared to an equivalent number of random 100 bp regions (gray bar). (D) Representative Gene Ontology term annotation of cluster 4 (days 9 & 28) by GREAT. Each term is annotated with the observed (Obs.) number of Runx2 peaks and corresponding number of genes out of the total number of genes.
Figure 4
Figure 4
Runx2 binding at known osteogenic genes and a potential target, Ezh2, during osteoblastogenesis. (A) Runx2 binding at three known osteogenic genes, Runx2, Osx, and Ocn, during three stages of osteogenesis: proliferation (day 0); matrix deposition (day 9); and mineralization (day 28). Gene annotation follows standard gene prediction display conventions used by the UCSC genome browser (exons, solid boxes; introns, solid lines; direction of gene transcription, arrows). Positions of Runx2 peaks called by MACS (green bars) and Runx2 consensus motif (TGTGGT; solid black bar) are also depicted. (B)Ezh2 locus bound by Runx2 with increasing Runx2 enrichment over temporal stages of osteogenesis. (C)Ezh2 expression during osteogenesis (relative to day 0 levels) were determined by quantitative RT-PCR and normalized by Hprt1 mRNA levels. Relative mRNA levels are plotted as mean ± SEM from three independent biological replicates.
Figure 5
Figure 5
Correlation of Runx2 occupancy and Runx2-reponsive genes identifies novel targets. (A) Expression levels of genes responsive to Runx2 silencing in differentiated MC3T3-E1 cells. Values are plotted as the log2(expression level) from shRunx2-expressing cells (vertical axis) versus control shRNA expression (horizontal axis). Each point represents mean mRNA expression level from three independent biological replicates. Several representative genes are labeled. Diagonal lines demarcate the threshold for significant increase or decrease (≥1.5-fold) in expression. (B-D) Runx2 peaks associated with upregulated (Up), downregulated (Down), or unchanged (Non-responsive) gene expression upon Runx2 knockdown were compared by: average peak number per gene (B), and peak distribution (C) and fold change of peak signals (d9 versus d0) across genomic locations (D) with shRunx2 non-responsive genes as a control. In (B), three groups were compared to non-responsive genes: all peaks in shRunx2-regulated genes (All peaks), all peaks present at day 9 in shRunx2-regulated genes (D9 peaks), and all peaks present at day 0 in shRunx2 regulated genes (D0 peaks). Values are mean ± SEM (B,D) and statistical significance (*P < 0.01, **P < 0.05) determined by Mann-Whitney test (B,D) or Fisher’s exact test (C). (E) Runx2 enrichment across gene bodies (±10 kb) of genes downregulated (Down), upregulated (Up), and unchanged (Non-responsive) by shRunx2 treatment at day 9. Mean signal ratios (IP/Input) at each genomic region were determined using PeaksToGenes. Error bars represent SEM. (F) Mean phyloP conservation scores of Runx2 motifs associated with genes significantly (fold change ≥1.5, FDR <0.05) downregulated (Down), upregulated (Up), or unchanged (Non-responsive) upon shRunx2-treatment. Conservation of Runx2 motifs was compared between shRunx2 downregulated and upregulated genes and length-matched non-responsive genes (Non-responsive, Down and Up, respectively) and statistical significance determined (**P < 0.05) by Kolmogorov-Smirnov test.
Figure 6
Figure 6
Non-promoter association of Runx2 regulates novel targets Adamts4 and Crabp2. (A) Increasing Runx2 enrichment was observed in the first intron (peak A, boxed region) and last exon (peak B, boxed region) of the Adamts4 locus during osteogenic differentiation. (B) Adamts4 mRNA levels (normalized to Hprt1) were significantly upregulated (P < 0.05) in differentiating MC3T3-E1 cells (days 9 to 28) when compared to proliferating cells (day 0). (C) Runx2 knockdown (shRunx2) decreases Adamts4 expression, compared to a scrambled shRNA (Scr) control (**P < 0.05). (D) DNA sequences identical to peak regions A and B were cloned into individual pGL2-SV40-Luc reporters and relative luciferase activity was measured in transfected MC3T3-E1 cells and significant increases and decreases (*P < 0.01) in luciferase activity were observed for peak A and B reporters, respectively. (E) Increasing Runx2 enrichment was observed up- (peak C) and downstream (peaks D and E) of the Crabp2 locus during osteogenic differentiation. (F) Crabp2 expression increases during differentiation. Knockdown of Runx2 (by shRunx2) significantly reduces (**P < 0.05) the endogenous expression of Crabp2 (right panel). (G) DNA sequences identical to peak regions C, D and E were cloned into individual pGL2-SV40-Luc reporters and relative luciferase activity was measured in transfected MC3T3-E1 cells at days 0 and 7 (*P < 0.01). (H) Runx2 knockdown by inducible shRNA results in a significant decrease (**P < 0.05) of luciferase activity mediated by peak C and E regions and a downward trend (P = 0.08) in luciferase activity regulated by peak D region. Statistical significance for all experiments was determined by Student’s t-test from mean ± SEM from three biological replicates.

Similar articles

Cited by

References

    1. Komori T. Signaling networks in RUNX2-dependent bone development. J Cell Biochem. 2011;112:750–755. doi: 10.1002/jcb.22994. - DOI - PubMed
    1. Lian JB, Stein GS, Javed A, van Wijnen AJ, Stein JL, Montecino M, Hassan MQ, Gaur T, Lengner CJ, Young DW. Networks and hubs for the transcriptional control of osteoblastogenesis. Rev Endocr Metab Disord. 2006;7:1–16. - PubMed
    1. Long F. Building strong bones: molecular regulation of the osteoblast lineage. Nat Rev Mol Cell Biol. 2012;13:27–38. - PubMed
    1. Otto F, Kanegane H, Mundlos S. Mutations in the RUNX2 gene in patients with cleidocranial dysplasia. Hum Mutat. 2002;19:209–216. doi: 10.1002/humu.10043. - DOI - PubMed
    1. Hecht J, Seitz V, Urban M, Wagner F, Robinson PN, Stiege A, Dieterich C, Kornak U, Wilkening U, Brieske N, Zwingman C, Kidess A, Stricker S, Mundlos S. Detection of novel skeletogenesis target genes by comprehensive analysis of a Runx2(-/-) mouse model. Gene Expr Patterns. 2007;7:102–112. doi: 10.1016/j.modgep.2006.05.014. - DOI - PubMed

Publication types

Substances