Computational analyses of synergism in small molecular network motifs
- PMID: 24651495
- PMCID: PMC3961176
- DOI: 10.1371/journal.pcbi.1003524
Computational analyses of synergism in small molecular network motifs
Abstract
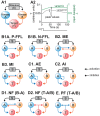
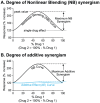
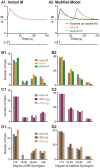
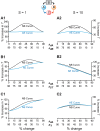
Cellular functions and responses to stimuli are controlled by complex regulatory networks that comprise a large diversity of molecular components and their interactions. However, achieving an intuitive understanding of the dynamical properties and responses to stimuli of these networks is hampered by their large scale and complexity. To address this issue, analyses of regulatory networks often focus on reduced models that depict distinct, reoccurring connectivity patterns referred to as motifs. Previous modeling studies have begun to characterize the dynamics of small motifs, and to describe ways in which variations in parameters affect their responses to stimuli. The present study investigates how variations in pairs of parameters affect responses in a series of ten common network motifs, identifying concurrent variations that act synergistically (or antagonistically) to alter the responses of the motifs to stimuli. Synergism (or antagonism) was quantified using degrees of nonlinear blending and additive synergism. Simulations identified concurrent variations that maximized synergism, and examined the ways in which it was affected by stimulus protocols and the architecture of a motif. Only a subset of architectures exhibited synergism following paired changes in parameters. The approach was then applied to a model describing interlocked feedback loops governing the synthesis of the CREB1 and CREB2 transcription factors. The effects of motifs on synergism for this biologically realistic model were consistent with those for the abstract models of single motifs. These results have implications for the rational design of combination drug therapies with the potential for synergistic interactions.
Conflict of interest statement
The authors have declared that no competing interests exist.
Figures


Similar articles
-
Dynamics of a minimal model of interlocked positive and negative feedback loops of transcriptional regulation by cAMP-response element binding proteins.Biophys J. 2007 May 15;92(10):3407-24. doi: 10.1529/biophysj.106.096891. Epub 2007 Feb 2. Biophys J. 2007. PMID: 17277187 Free PMC article.
-
Hierarchical structure and modules in the Escherichia coli transcriptional regulatory network revealed by a new top-down approach.BMC Bioinformatics. 2004 Dec 16;5:199. doi: 10.1186/1471-2105-5-199. BMC Bioinformatics. 2004. PMID: 15603590 Free PMC article.
-
Modular genetic regulatory networks increase organization during pattern formation.Biosystems. 2016 Aug;146:77-84. doi: 10.1016/j.biosystems.2016.04.004. Epub 2016 Jun 17. Biosystems. 2016. PMID: 27327866
-
Bacterial molecular networks: bridging the gap between functional genomics and dynamical modelling.Methods Mol Biol. 2012;804:1-11. doi: 10.1007/978-1-61779-361-5_1. Methods Mol Biol. 2012. PMID: 22144145 Review.
-
Memorizing environmental signals through feedback and feedforward loops.Curr Opin Cell Biol. 2021 Apr;69:96-102. doi: 10.1016/j.ceb.2020.11.008. Epub 2021 Feb 4. Curr Opin Cell Biol. 2021. PMID: 33549848 Free PMC article. Review.
Cited by
-
Systematic synergy modeling: understanding drug synergy from a systems biology perspective.BMC Syst Biol. 2015 Sep 16;9:56. doi: 10.1186/s12918-015-0202-y. BMC Syst Biol. 2015. PMID: 26377814 Free PMC article.
-
Bifurcation-based approach reveals synergism and optimal combinatorial perturbation.J Biol Phys. 2016 Jun;42(3):399-414. doi: 10.1007/s10867-016-9414-7. Epub 2016 Apr 14. J Biol Phys. 2016. PMID: 27079194 Free PMC article.
-
Simulations suggest pharmacological methods for rescuing long-term potentiation.J Theor Biol. 2014 Nov 7;360:243-250. doi: 10.1016/j.jtbi.2014.07.006. Epub 2014 Jul 15. J Theor Biol. 2014. PMID: 25034337 Free PMC article.
-
Extending the lymphoblastoid cell line model for drug combination pharmacogenomics.Pharmacogenomics. 2021 Jun;22(9):543-551. doi: 10.2217/pgs-2020-0160. Epub 2021 May 28. Pharmacogenomics. 2021. PMID: 34044623 Free PMC article. Review.
-
Modeling suggests combined-drug treatments for disorders impairing synaptic plasticity via shared signaling pathways.J Comput Neurosci. 2021 Feb;49(1):37-56. doi: 10.1007/s10827-020-00771-4. Epub 2020 Nov 11. J Comput Neurosci. 2021. PMID: 33175283 Free PMC article.
References
-
- Milo R, Shen-Orr S, Itzkovitz S, Kashtan N, Chkiovskii D, et al. (2002) Network motifs: simple building blocks of complex networks. Science 298: 824–827. - PubMed
-
- Goemann B, Wingender E, Potapov AP (2009) An approach to evaluate the topological significance of motifs and other patterns in regulatory networks. BMC Syst Biol 3: 53 doi:10.1186/1752-0509-3-53 - DOI - PMC - PubMed
-
- Kaizu K, Ghosh S, Matsuoka Y, Moriya H, Shimizu-Yoshida Y, et al. (2010) A comprehensive molecular interaction map of the yeast cell cycle. Mol Syst Biol 6: 415 doi:10.1038/msb.2010.73 - DOI - PMC - PubMed
-
- Cui Q, Ma Y, Jaramillo M, Bari H, Awan A, et al. (2007) A map of human cancer signaling. Mol Syst Biol 3: 152 doi:10.103/msb4100200 - DOI - PMC - PubMed
Publication types
MeSH terms
Substances
Grants and funding
LinkOut - more resources
Full Text Sources
Other Literature Sources

