. 2014 May 9;289(19):13543-53.
doi: 10.1074/jbc.M114.553321. Epub 2014 Mar 19.

Decreased O-linked GlcNAcylation protects from cytotoxicity mediated by huntingtin exon1 protein fragment

Affiliations

Decreased O-linked GlcNAcylation protects from cytotoxicity mediated by huntingtin exon1 protein fragment

Amit Kumar et al. J Biol Chem. .

Abstract

O-GlcNAcylation is an important post-translational modification of proteins and is known to regulate a number of pathways involved in cellular homeostasis. This involves dynamic and reversible modification of serine/threonine residues of different cellular proteins catalyzed by O-linked N-acetylglucosaminyltransferase and O-linked N-acetylglucosaminidase in an antagonistic manner. We report here that decreasing O-GlcNAcylation enhances the viability of neuronal cells expressing polyglutamine-expanded huntingtin exon 1 protein fragment (mHtt). We further show that O-GlcNAcylation regulates the basal autophagic process and that suppression of O-GlcNAcylation significantly increases autophagic flux by enhancing the fusion of autophagosome with lysosome. This regulation considerably reduces toxic mHtt aggregates in eye imaginal discs and partially restores rhabdomere morphology and vision in a fly model for Huntington disease. This study is significant in unraveling O-GlcNAcylation-dependent regulation of an autophagic process in mediating mHtt toxicity. Therefore, targeting the autophagic process through the suppression of O-GlcNAcylation may prove to be an important therapeutic approach in Huntington disease.

Keywords: Autophagy; Neurodegenerative Diseases; O-GlcNAcylation; Post-translational Modification; Protein Aggregation.


Figures
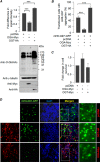
FIGURE 1.
FIGURE 1.
Suppression of O-GlcNAcylation significantly reduces mHtt-Q97 aggregates. A, Neuro2A cells transfected with an empty vector (pcDNA) or expression construct for OGA-Myc and OGT-HA were evaluated for changes in the global O-glycosylation level by immunoblotting. Expression of OGA and OGT was confirmed by probing with the tag antibodies. Probing with γ-tubulin served as loading control. The bar diagram shown above represent the fold change in the signal intensity of O-glycosylated proteins (normalized to γ-tubulin in the immunoblot) as measured by densitometric analysis (n = 3; ***, p < 0.001). B, bar diagram representing percent transfected cells showing the aggregation of mHtt-Q97-GFP when expressed alone (pcDNA) or with an expression construct coding for OGA-Myc or OGT-HA, as indicated. Note the significant reduction in the transfected cells positive for mHtt-Q97-GFP aggregates when OGA was co-expressed but a significant increase in their frequency when OGT was co-expressed (n = 3; ***, p < 0.001). C, bar diagram showing fold change in survival of cells transiently expressing OGA or OGT as compared with cells transfected with an empty vector (pcDNA), as measured by MTT assay (n = 3). D, representative fluorescence microscopic images (first 4 columns with a ×10 objective) showing aggregation patterns of mHtt-Q97-GFP in Neuro2A cells when expressed alone (pcDNA) and when co-expressed with OGA-Myc or OGT-HA. The intense green signals in the mHtt-Q97-GFP column represent mHtt-Q97 aggregates. The red signal reveals the expression of OGA-Myc or OGT-HA. Nuclei were stained with DAPI (blue). Areas boxed in the merged column are enlarged in the last column to more clearly show the GFP-positives cells with or without aggregates.
FIGURE 2.
FIGURE 2.
O-GlcNAcylation inhibition reduces mHtt-Q97-mediated cytotoxicity. A, Western blot images of the insoluble, aggregated form of mHtt-Q97-GFP in filter trap assay using a slot-blot apparatus (top) or its total form resolved by immunoblotting (bottom) when expressed with either pcDNA (empty vector control), OGT, or OGA, as indicated in the middle. Expression of OGT and OGA was established by probing them with anti-HA and anti-Myc antibodies, respectively. The bar diagram above shows the fold changes in signal intensities, based on densitometric analysis of the SDS-insoluble and -aggregated form of mHtt-Q97-GFP (normalized to total level detected in the immunoblot; n = 3; ***, p < 0.001; *, p < 0.1). B and C, bar diagrams representing the fold change in the viability of cells expressing mHtt-Q97-GFP (B) or the α-synuclein mutant A40P (C) as measured by an MTT assay. Cells transfected with the indicated constructs were processed for the measurement, and in each set the value obtained for the GFP-transfected cells was considered as 1, and the relative values obtained for indicated combinations were plotted. D and E, bar diagram showing the percentage of cells expressing mHtt-Q97-GFP (D) or the α-synuclein mutant A40P (E) with abnormal (apoptotic) nuclei (as shown in F) as compared with cells that expressed GFP (control) when co-transfected with OGA or OGT coding constructs (in B–E, n = 3; **, p < 0.05; ***, p < 0.005 on Student's t test). F, representative images showing a normal (left) and an abnormal (apoptotic; right) nuclei as judged by DAPI staining (scale, 5 μm).
FIGURE 3.
FIGURE 3.
O-GlcNAcylation modulates autophagy. A, immunoblots (bottom panel) of Neuro2A cells, transiently expressing pcDNA empty vector alone or OGA-Myc or OGT-HA for 36 h, to show levels of the autophagic markers LC3II and p62. Probing with anti-γ-tubulin served as loading control. Note the change in the level of LC3II band (identified by an arrow) in cells that expressed OGA. Co-expression of OGT did not show such an effect. Bar diagrams above show the fold changes in signal intensities of the LC3II and p62 (both normalized to γ-tubulin signal) bands when compared with the control (pcDNA transfected cells). B, Neuro2A cells were grown in a medium with or without azaserine and/or glucosamine for 12 h as indicated, and the changes in the global glycosylation level were evaluated. The bar diagrams above show the fold changes in the glycosylation levels compared with cells that were fed with glucose. C, samples shown in B were tested for the level of autophagy markers LC3 and p62 as indicated. Note the reduction in the intensity of the band for LC3II (identified by an arrow) and p62 in the azaserine-treated cells and their restoration in the azaserine/glucosamine double-treated cells. Bar diagrams above represent the fold changes in the signal intensities for LC3II and p62 (both normalized to γ-tubulin signal) bands compared with the control (glucose-fed cells) (in A–C, n = 3; *, p < 0.5; **, p < 0.05; ***, p < 0.005 on Student's t test).
FIGURE 4.
FIGURE 4.
Suppression of O-GlcNAcylation increases autophagy flux. A, Neuro2A cells at 24 h post-transient transfection with an empty vector (pcDNA) or with a construct coding for OGA or OGT were either left untreated or treated with BafA1 for 12 h as indicated, and the levels of autophagy markers LC3 and p62 were evaluated by immunoblotting. Note the increase in the signal intensities of LC3II (arrow) and p62 in all samples treated with BafA1. The blot was probed with anti-Myc and anti-HA antibodies to show the expression of OGA and OGT, respectively; probing with anti-γ-tubulin served as the loading control. B, immunoblot to show levels of LC3II (arrow) and p62 in Neuro2A cells, as in A, untreated or treated with azaserine, alone or in combination with BafA1 as indicated; γ-Tubulin served as the loading control. Bar diagrams above represent the fold changes in the signal intensities for LC3II and p62 (both normalized to γ-tubulin signal) bands compared with the control (n = 3; **, p < 0.05; ***, p < 0.005 on Student's t test).
FIGURE 5.
FIGURE 5.
Suppression of O-GlcNAcylation increases autophagy flux. A, representative images of cells showing LC3-positive puncta in cells that were transiently transfected with mRFP-GFP-LC3 expression construct along with an empty vector (pcDNA) or an expression construct coding for OGA or OGT as indicated. Puncta that are positive both for red and green fluorescence represent autophagosomes, although those positive only for red fluorescence represent autolysosomes (bar, 10 μm). B, bar diagram showing the fraction of puncta positive for both RFP and GFP (yellow) or only the RFP (red) in transiently transfected cells co-expressing mRFP-GFP-LC3 and pcDNA or OGA or OGT, as indicated. n = 3; **, p < 0.5; ***, p < 0.05 on Student's t test).
FIGURE 6.
FIGURE 6.
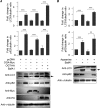
Suppression of O-GlcNAcylation increases autophagy flux. Western blots showing changes in the levels of insoluble, aggregated form of mHtt-Q97-GFP (filter trap assay; top) or its total form (immunoblotting; bottom) when expressed with OGA and treated or not treated with BafA1 (A) or 3-MA (B) as indicated. The bar diagrams, shown above, represent fold changes in the signal intensity of the SDS-insoluble, aggregated form of mHtt-Q97-GFP (normalized to total level detected in the immunoblot) as measured by densitometric analysis (n = 3; *, p < 0.1; **, p < 0.01; ***, p < 0.001).
FIGURE 7.
FIGURE 7.
Effect of O-GlcNAcylation on proteasomal activity. Bar diagram showing fold change in the proteasomal activity in cells transiently transfected with a construct coding for OGA, OGT, or an empty vector (pcDNA) (A) or with the drug azaserine or glucosamine (B) in the presence or absence proteasomal blocker MG132, as indicated (n = 3; *, p < 0.5; ***, p < 0.05 on Student's t test).
FIGURE 8.
FIGURE 8.
Azaserine feeding reduces accumulation of mutant Huntingtin protein in fly model. A–D, confocal projection images (projections of four consecutive optical sections which show the morphogenetic furrow) of eye imaginal discs of late third instar GMR-GAL4 > UAS-httex1p Q93 Drosophila larvae, reared from the first instar stage onward to normal (A and B) or azaserine-supplemented food (C and D), immunostained for HA-tagged mutant Htt (green, A–D, identified as “PolyQ”); nuclei are counterstained with DAPI (blue, B and D). The insets in A and C are higher magnification images of a part of the eye discs in A and C, respectively, to more clearly show the polyQ aggregates, which are very abundant in A but nearly absent in C. Arrows in B and D indicate position of the morphogenetic furrow. Scale bar in A represents 20 μm and applies to A–D. E, immunoblot of total proteins from heads of 1-day-old GMR-GAL4/UAS-htt-ex1p Q93 flies, reared on normal (−) or azaserine-supplemented (+) food because the first instar stage, probed with anti-HA antibody, was used to detect Htt-Q93 protein. F, histograms show mean relative levels of HA-tagged polyQ protein (mean ratios of Htt-Q93 and γ-tubulin densities) determined from triplicate immunoblots as in E; the mean ratio of HttQ93 and γ-tubulin densities in Aza-food was taken as 1. (*, p < 0.001.)
FIGURE 9.
FIGURE 9.
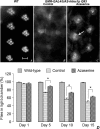
Azaserine feeding suppresses mHttQ93-induced neurodegeneration in adult Drosophila eyes and reduces the age-dependent loss of vision. A, pseudopupil images of eyes of 1-day-old wild type, or GMR-GAL4 > UAS-httex1p Q93 flies grown on control (B), or on azaserine-containing food (C). Arrow in C indicates the presence of two distinct rhabdomeres in one of the ommatidial units; these are not seen in any ommatidial unit in control flies. Scale bar in A indicates 20 μm and applies to A–C. D, histograms showing phototaxis (percent flies moving to illuminated chamber, y axis) of wild type and GMR-GAL4 > UAS-httex1p Q93 flies reared on control or azaserine-supplemented food on different days (x axis) after emergence. Each value in the bar diagram is the mean of 20 replicates with 10 flies in each set. The * in bar diagrams indicates the p value to be <0.05 when comparing the mean phototaxis of GMR-GAL4 > UAS-httex1p Q93 flies reared on control (Cont) and azaserine (Aza)-supplemented food, respectively, on days 5, 10, and 15.

Similar articles

Cited by

References

    1. Love D. C., Hanover J. A. (2005) The hexosamine signaling pathway: deciphering the “O-GlcNAc code”. Sci. STKE 2005, re13 - PubMed
    1. Vocadlo D. J. (2012) O-GlcNAc processing enzymes: catalytic mechanisms, substrate specificity, and enzyme regulation. Curr. Opin. Chem. Biol. 16, 488–497 - PubMed
    1. Butkinaree C., Park K., Hart G. W. (2010) O-Linked β-N-acetylglucosamine (O-GlcNAc): extensive crosstalk with phosphorylation to regulate signaling and transcription in response to nutrients and stress. Biochim. Biophys. Acta 1800, 96–106 - PMC - PubMed
    1. Chatham J. C., Marchase R. B. (2010) Protein O-GlcNAcylation: a critical regulator of the cellular response to stress. Curr. Signal. Transduct. Ther. 5, 49–59 - PMC - PubMed
    1. Bond M. R., Hanover J. A. (2013) O-GlcNAc cycling: a link between metabolism and chronic disease. Annu. Rev. Nutr. 33, 205–229 - PMC - PubMed

Publication types

LinkOut - more resources