

Broad scope method for creating humanized animal models for animal health and disease research through antibiotic treatment and human fecal transfer
- PMID: 24637796
- PMCID: PMC4063843
- DOI: 10.4161/gmic.28403
Broad scope method for creating humanized animal models for animal health and disease research through antibiotic treatment and human fecal transfer
Abstract
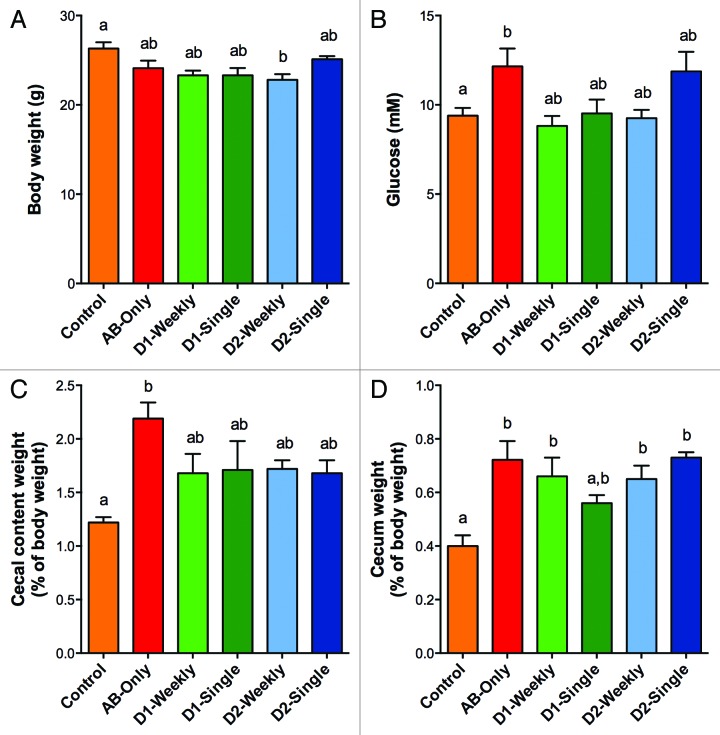
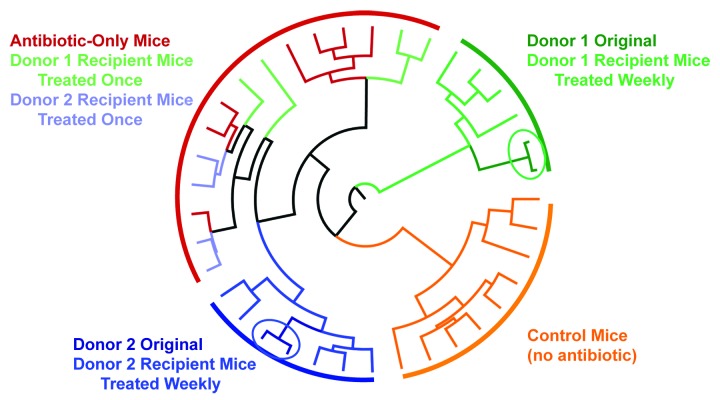
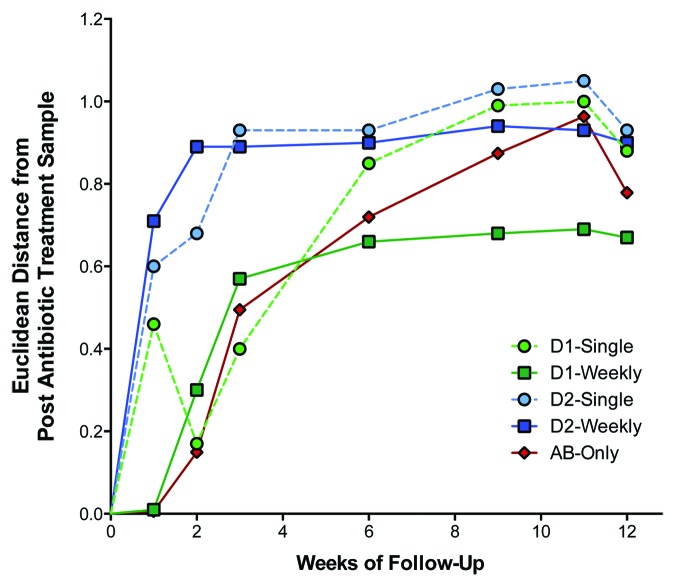
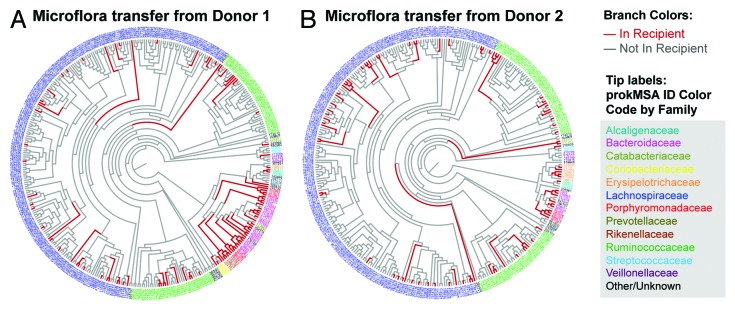
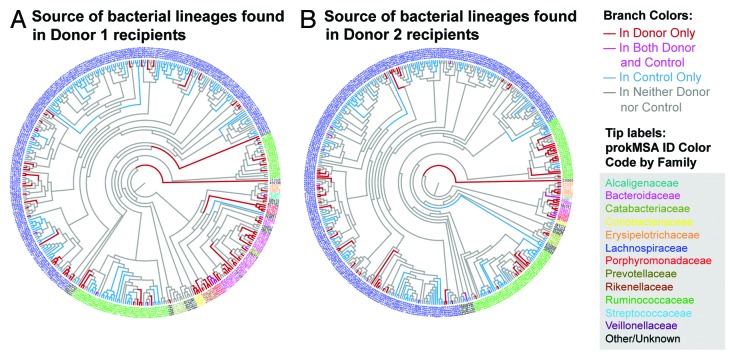
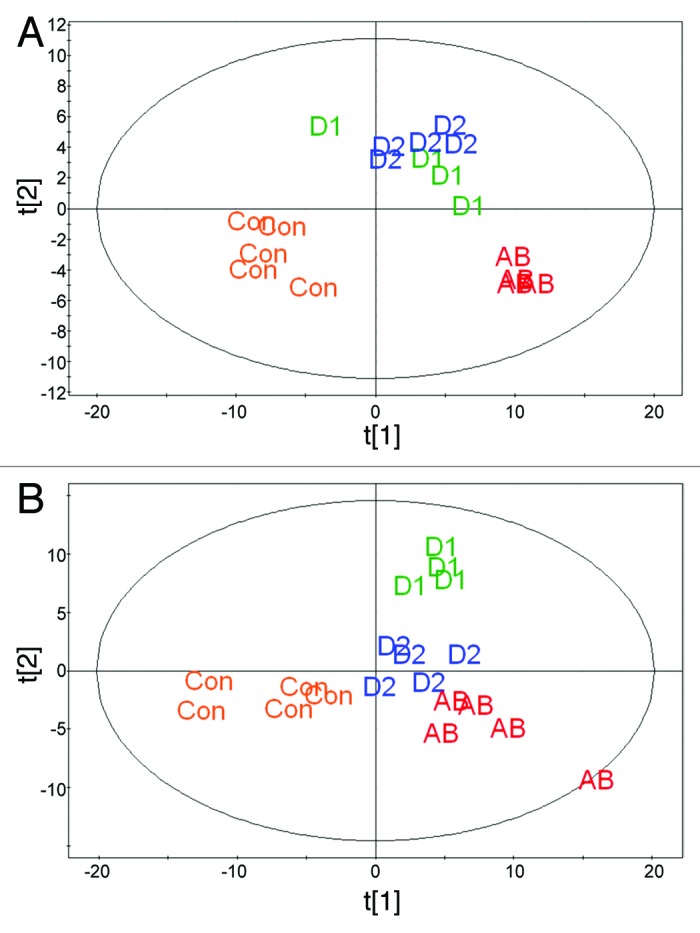
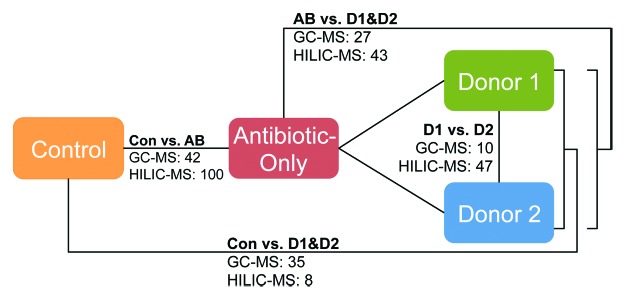
Traditionally, mouse humanization studies have used human fecal transfer to germ-free animals. This practice requires gnotobiotic facilities and is restricted to gnotobiotic mouse lines, which limits humanized mouse research. We have developed a generalizable method to humanize non germ-free mice using antibiotic treatment and human fecal transfer. The method involves depleting resident intestinal microbiota with broad-spectrum antibiotics, introducing human microbiota from frozen fecal samples by weekly gavage, and maintaining mice in HEPA-filtered microisolator cages. Pyrosequencing cecal microbiota 16S rRNA genes showed that recipient mice adopt a humanized microbiota profile analogous to their human donors, and distinct from mice treated with only antibiotics (no fecal transfer) or untreated control mice. In the humanized mice, 75% of the sequence mass was observed in their respective human donor and conversely, 68% of the donor sequence mass was recovered in the recipient mice. Principal component analyses of GC- and HPLC-separated cecal metabolites were performed to determine effects of transplanted microbiota on the metabolome. Cecal metabolite profiles of mice treated with only antibiotics (no fecal transfer) and control mice were dissimilar from each other and from humanized mice. Metabolite profiles for mice humanized from different donor samples clustered near each other, yet were sufficiently distinct that separate clusters were apparent for each donor. Also, cecal concentrations of 57 metabolites were significantly different between humanization treatments. These data demonstrate that our protocol can be used to humanize non germ-free mice and is sufficiently robust to generate metabolomic differences between mice humanized from different human donors.
Keywords: antibiotics; cecal metabolites; fecal transfer; gut microbiota; humanization; mice.
Figures
Similar articles
-
A Double Humanized BLT-mice Model Featuring a Stable Human-Like Gut Microbiome and Human Immune System.J Vis Exp. 2019 Aug 30;(150):10.3791/59773. doi: 10.3791/59773. J Vis Exp. 2019. PMID: 31524867 Free PMC article.
-
A metabolomic view of how the human gut microbiota impacts the host metabolome using humanized and gnotobiotic mice.ISME J. 2013 Oct;7(10):1933-43. doi: 10.1038/ismej.2013.89. Epub 2013 Jun 6. ISME J. 2013. PMID: 23739052 Free PMC article.
-
Stable engraftment of human microbiota into mice with a single oral gavage following antibiotic conditioning.Microbiome. 2017 Aug 1;5(1):87. doi: 10.1186/s40168-017-0306-2. Microbiome. 2017. PMID: 28760163 Free PMC article.
-
Procedures for Fecal Microbiota Transplantation in Murine Microbiome Studies.Front Cell Infect Microbiol. 2021 Sep 21;11:711055. doi: 10.3389/fcimb.2021.711055. eCollection 2021. Front Cell Infect Microbiol. 2021. PMID: 34621688 Free PMC article. Review.
-
Humanizing the gut microbiota of mice: Opportunities and challenges.Lab Anim. 2019 Jun;53(3):244-251. doi: 10.1177/0023677218787554. Epub 2018 Aug 8. Lab Anim. 2019. PMID: 30089440 Review.
Cited by
-
Sheep fecal transplantation affects growth performance in mouse models by altering gut microbiota.J Anim Sci. 2022 Nov 1;100(11):skac303. doi: 10.1093/jas/skac303. J Anim Sci. 2022. PMID: 36075210 Free PMC article.
-
Variations in diet cause alterations in microbiota and metabolites that follow changes in disease severity in a multiple sclerosis model.Benef Microbes. 2018 Apr 25;9(3):495-513. doi: 10.3920/BM2017.0116. Epub 2018 Jan 30. Benef Microbes. 2018. PMID: 29380645 Free PMC article.
-
Basal Diet Fed to Recipient Mice Was the Driving Factor for Colitis and Colon Tumorigenesis, despite Fecal Microbiota Transfer from Mice with Severe or Mild Disease.Nutrients. 2023 Mar 9;15(6):1338. doi: 10.3390/nu15061338. Nutrients. 2023. PMID: 36986068 Free PMC article.
-
Gut microbiota depletion by chronic antibiotic treatment alters the sleep/wake architecture and sleep EEG power spectra in mice.Sci Rep. 2020 Nov 11;10(1):19554. doi: 10.1038/s41598-020-76562-9. Sci Rep. 2020. PMID: 33177599 Free PMC article.
-
The gut microbiome is associated with susceptibility to febrile malaria in Malian children.Nat Commun. 2024 Nov 5;15(1):9525. doi: 10.1038/s41467-024-52953-8. Nat Commun. 2024. PMID: 39500866 Free PMC article.
References
Publication types
MeSH terms
Substances
LinkOut - more resources
Full Text Sources
Other Literature Sources
Miscellaneous