. 2014 Mar 13;156(6):1139-1152.
doi: 10.1016/j.cell.2014.01.050.

A cortical circuit for gain control by behavioral state

Affiliations

A cortical circuit for gain control by behavioral state

Yu Fu et al. Cell. .

Abstract

The brain's response to sensory input is strikingly modulated by behavioral state. Notably, the visual response of mouse primary visual cortex (V1) is enhanced by locomotion, a tractable and accessible example of a time-locked change in cortical state. The neural circuits that transmit behavioral state to sensory cortex to produce this modulation are unknown. In vivo calcium imaging of behaving animals revealed that locomotion activates vasoactive intestinal peptide (VIP)-positive neurons in mouse V1 independent of visual stimulation and largely through nicotinic inputs from basal forebrain. Optogenetic activation of VIP neurons increased V1 visual responses in stationary awake mice, artificially mimicking the effect of locomotion, and photolytic damage of VIP neurons abolished the enhancement of V1 responses by locomotion. These findings establish a cortical circuit for the enhancement of visual response by locomotion and provide a potential common circuit for the modulation of sensory processing by behavioral state.


Figures

Figure 1
Figure 1
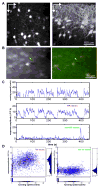
Calcium imaging of VIP neurons in vivo in behaving mouse. (A) Images in vivo of V1 in VIP-Cre::Ai14 mouse. Left panel shows projection along z-axis, and is a ‘top-down view’ of the brain showing the lateral distribution of VIP neurons. Right panel shows projection along x-axis, and is a ‘side view’ of the brain showing the distribution of VIP neurons across different cortical layers. (B) After loading OGB-1, images were taken at 800nm (green channel only, left panel) to image the calcium response, and at 910nm to visualize the TdTomato-expressing VIP neurons (right panel). Red arrows point to a VIP neuron; green arrows indicate a non-VIP neuron. (C) Example showing calcium responses of the VIP (middle) and non-VIP (bottom) neurons shown in (B) in relation to running speed (top). (D) The distribution of the calcium signal in relation to the running speed for each signal point of the traces in (C). The side panels show the count of signal points along corresponding axis. The red line is the average fluorescent value along the running axis smoothed with a 50-data point sliding window.
Figure 2
Figure 2
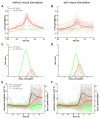
Calcium responses of VIP neurons are closely correlated with running and are modulated by visual stimulation. (A–B) The cross-correlation between the calcium response and running speed chart, when imaged with (B) or without (A) visual stimulation. The thin red lines are the cross-correlation curves of all recorded VIP neurons (A, n=28, 4 mice; B, n=44, 7 mice). The thick red curve is the average of all thin red curves. The thick green curve is the average of the cross-correlation curves of all recorded non-VIP neurons (A, n=77, 4 mice; B, n=76, 7 mice). (C–D) The distribution of the zero-time cross-correlation value of all recorded VIP and non-VIP neurons, when imaged with (C) or without (D) visual stimulation. The green and red curves are fitted curve with Gaussian distribution. (E–F) The calcium responses of VIP (red traces) and non-VIP neurons (green traces) aligned to the running episodes (black traces), when imaged with (E) or without (F) visual stimulation. Each thin trace (red or green) is the average of all extracted responses of a single cell.
Figure 3
Figure 3
Locomotion differentially modulates the responses of different types of inhibitory neurons. (A–C) The cross-correlation between the GCaMP6s calcium signal and running speed chart for VIP (A), PV (B) and SST (C) neurons. The thin lines are the cross-correlation curves of all recorded neurons (A, n=21; B, n=40; C, n=11). The thick curve is the average of all thin curves. Insert histograms show distribution of zero-time cross-correlation values, and the curves are fitted with single or double Gaussian functions. (D) The average zero-time cross-correlation for three different inhibitory neurons (mean±SEM). (E–G) The calcium responses of VIP (E), PV (F), and SST (G) neurons are aligned to the start of running episodes (black traces). Each thin trace is the average of all extracted events of a single neuron, and the thick trace is the average of all thin traces. Insert histograms show distribution of zero-time cross-correlation values between extracted running speed and calcium signal change of all extracted events of all neurons. (H) The average calcium response amplitude of the three types of inhibitory neurons. The values plotted are the average of the curves between 2s and 4s on the X-axis in (E–G) (mean±SEM). (I–K) The calcium responses of VIP (I), PV (J), and SST (K) neurons are aligned to the end of running episodes (black traces). Each thin trace is the average of all extracted events of a single neuron, and the thick trace is the average of all thin traces. Insert histograms show distribution of zero-time cross-correlation values between extracted running speed and calcium signal change of all extracted events of all neurons. (L) The average calcium response amplitude of three types of inhibitory neurons. The values plotted are the average of the curves between 1s to 3s on the X-axis in (I–K) (mean±SEM).
Figure 4
Figure 4
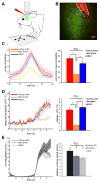
Activation of VIP neurons by locomotion via nAChRs. (A) Diagram showing the experimental setup. ouse with fixed head is free to run on a Styrofoam ball floating on air. After loading OGB-1, a glass pipet loaded with Alexa-594 and drug solutions is placed near the OGB-1 loading area under 2-photon imaging. (B) An example showing drug pipette and OGB-1 loading. (C) Left panel shows cross-correlation between calcium response and running speed of VIP neurons during local infusion of different drug solutions (mean±SEM; loading buffer, n=11, 3 mice; MEC&MLA, n=27, 4 mice; NBQX, n=17, 3 mice), when imaged without visual stimulation. Right panel shows zero-time cross-correlation values of VIP neurons under different drug conditions (mean±SEM, * p<0.01, one-way ANOVA and Bonferroni post hoc test). (D) Left panel shows calcium response aligned to each running episodes (mean±SEM). Right panel shows plateau response amplitude of calcium responses aligned to running (mean±SEM). (E) No effect of drug infusion on locomotion. Left panel shows extracted running episodes under different drug conditions (mean±SEM; loading buffer, n=23; MEC&MLA, n=89; NBQX, n=37). Right panel ishows running speed corresponding to the plateau calcium response shown in (D) (mean±SEM, * p>0.05, one-way ANOVA and Bonferroni post hoc test).
Figure 5
Figure 5
Retrograde labeling of monosynaptic inputs to upper layer VIP neurons in mouse V1. (A) AAV2/9-TRE-HTG was injected into V1 of VIP-Cre: ROSA-LSL-tTA mouse, and rabies virus (EnvA-SAD-ΔG-mcherry) was injected 2 weeks later into the same site. VIP neurons expressing hGFP were restricted to the upper layer. (B) The local input neurons to hGFP-expressing VIP neurons express mCherry and are located across different layers of V1. (C) Zoom-out view of the brain slice showing the injection site in V1. (D) Sparse labeling of input neurons and neurites in and near LGN. (E) Coronal section of the forebrain showing labeling of basal forebrain nucleus. (F) Zoom-in view of the labeling of diagonal band nucleus. (G) mCherry-expressing neurites and a pyramidal neuron in M2. (H) Labeling of pyramidal neurons in barrel cortex. (I) Labeling of pyramidal neurons in auditory cortex.
Figure 6
Figure 6
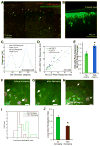
VIP neurons sufficient and necessary for modulation of gain of visual responses by locomotion. (A) Section of the visual cortex of a VIP-Cre:Ai14 mouse injected with AAV-DIO-ChETA-YFP. All VIP-Cre cells express tDTomato (red) and infected neurons also express ChETA-YFP (green). (B) Imaging in vivo of VIP neurons infected with AAV-DIO-ChETA-YFP through thinned skull craniotomy. (C) Orientation tuning of an isolated unit in control (No LED, green) condition and during optogenentic activation of VIP neuron (With LED, blue) condition, in a stationary VIP-Cre:Ai14 mouse injected with AAV-DIO-ChETA-YFP. Response values are average of 5 trials using moving bars; orientation tuning curves are fitted with double-Gaussian function. (D) Comparison of peak responses of isolated units in stationary mouse during control (No LED) condition and during optogenetic activation of VIP neuron (With LED) condition, in VIP-Cre:Ai14 mouse injected with AAV-DIO-ChETA-YFP (blue circles, 19 units, 3 animals) or without AAV injection (green circles, 16 units, 2 animals). (E) Average values of the ratio between With LED peak response and No LED peak response, of all the isolated units in either AAV-DIO-ChETA-YFP injected (blue bar) or no AAV injected (green bar) VIP-Cre:Ai14 animals (mean±SEM, * p<0.009 comparing with ‘No ChETA’ group, Mann-Whitney U-test). (F–J) Photolytically damaging VIP neurons abolishes increase of visual response induced by locomotion in non-VIP neurons. After loading OGB-1 into the V1 of VIP-Cre::Ai14 mice, area of interest was imaged before (F) and after (G) photolytic damaging of VIP neurons. Arrows indicate two VIP neurons. (H) VIP neurons become round and swollen 2h after photolytic damage. Arrows indicate two such VIP neurons. (I) The distribution of the locomotion-modulation-index (visual response during locomotion/visual response when stationary), of the ‘No Damaging’ (n=22) and ‘After Damaging’ (n=17) groups. (J) Average values of locomotion-modulation-index for ‘No Damaging’ and ‘After Damaging’ groups. (mean±SEM, * p<0.0001 comparing with ‘No Damaging’ group, rank-sum test)
Figure 7
Figure 7
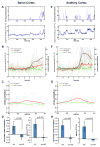
Locomotion activates VIP neurons in primary somatosensory and auditory cortices. (A) Example showing calcium response of a VIP neuron in barrel cortex in relation to running speed. (B) The calcium response of VIP (red traces, n=9, 3 mice) and non-VIP neurons (green traces, n=15, 3mice) in barrel cortex aligned to the running episodes (black traces). Each thin trace (red or green) is the average of all extracted responses of a single cell. (C) Cross-correlation between calcium responses and running speed. Thin red lines show cross-correlation curves of all recorded VIP neurons. The thick red curve is the average of all thin red curves. The thick green curve is the average of the cross-correlation curves of all recorded non-VIP neurons. (D) The average zero-time cross-correlation of VIP neurons is significantly different from that of non-VIP neurons (left panel, Mann-Whitney U-test). The average plateau amplitude of running-aligned calcium responses is significantly different from that of non-VIP neurons (Mann-Whitney U-test). (E–H) Corresponding data for auditory cortex.

Comment in

Similar articles

Cited by

References

    1. Adesnik H, Bruns W, Taniguchi H, Huang ZJ, Scanziani M. A neural circuit for spatial summation in visual cortex. Nature. 2012;490:226–231. - PMC - PubMed
    1. Alitto HJ, Dan Y. Cell-type-specific modulation of neocortical activity by basal forebrain input. Front Syst Neurosci. 2012;6:79. - PMC - PubMed
    1. Arroyo S, Bennett C, Aziz D, Brown SP, Hestrin S. Prolonged disynaptic inhibition in the cortex mediated by slow, non-alpha7 nicotinic excitation of a specific subset of cortical interneurons. J Neurosci. 2012;32:3859–3864. - PMC - PubMed
    1. Ayaz A, Saleem AB, Scholvinck ML, Carandini M. Locomotion controls spatial integration in mouse visual cortex. Curr Biol. 2013;23:890–894. - PMC - PubMed
    1. Bazhenov M, Timofeev I, Steriade M, Sejnowski TJ. Model of thalamocortical slow-wave sleep oscillations and transitions to activated States. J Neurosci. 2002;22:8691–8704. - PMC - PubMed

Publication types

Substances

LinkOut - more resources