
Dysregulation of ubiquitin homeostasis and β-catenin signaling promote spinal muscular atrophy

Thomas M Wishart et al. J Clin Invest. 2014 Apr.

Abstract

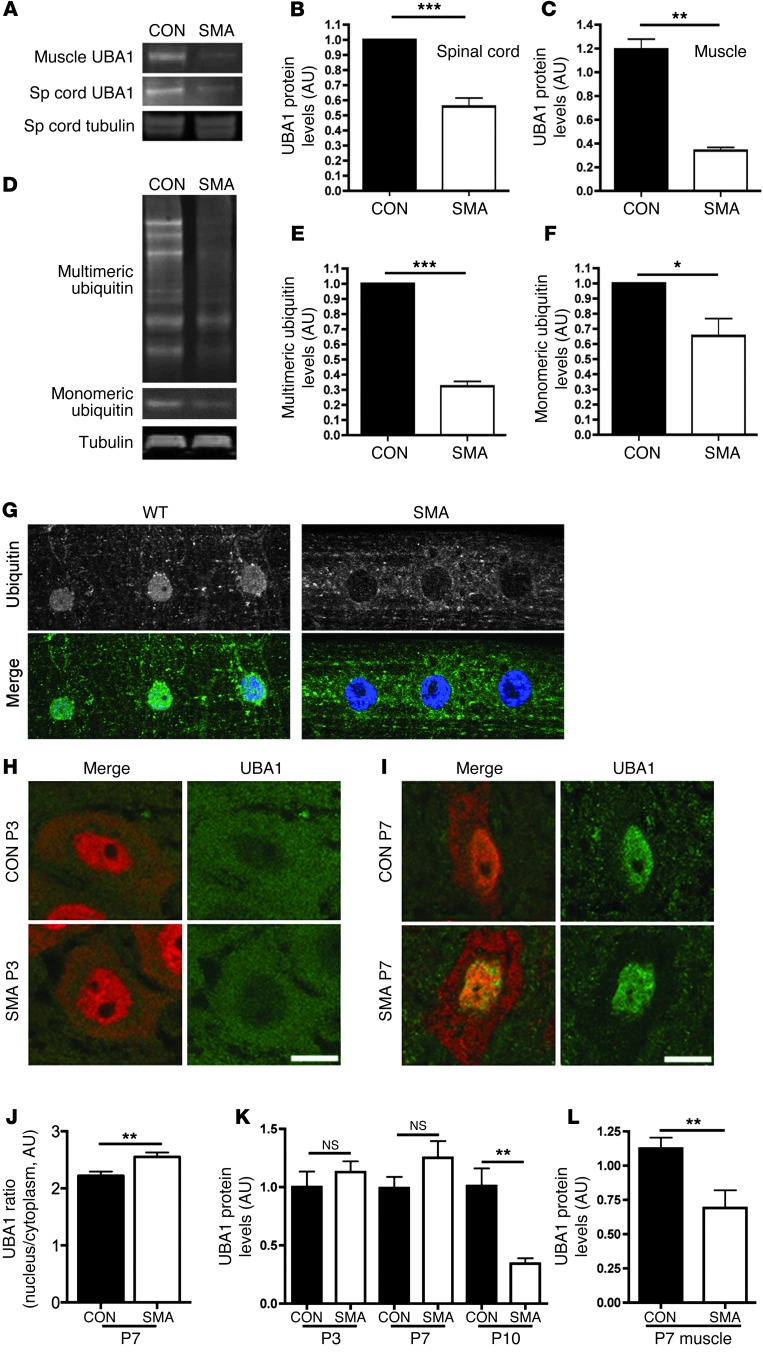
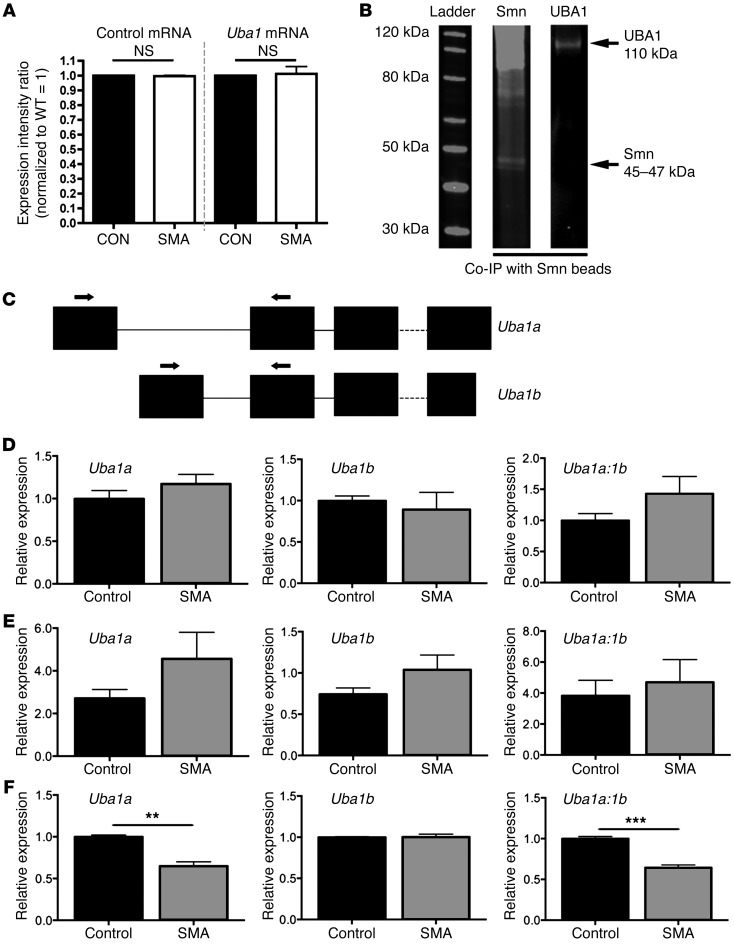
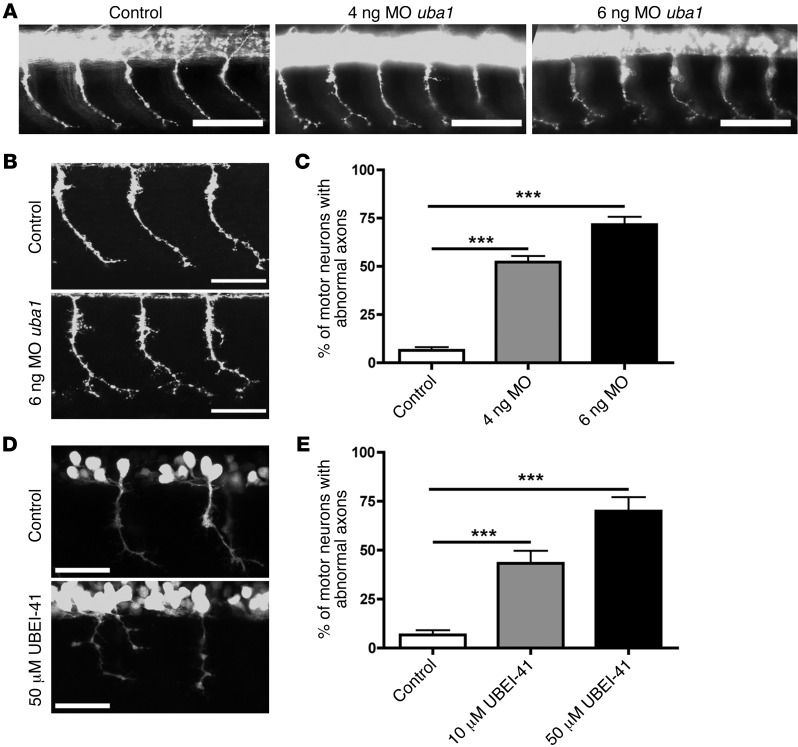
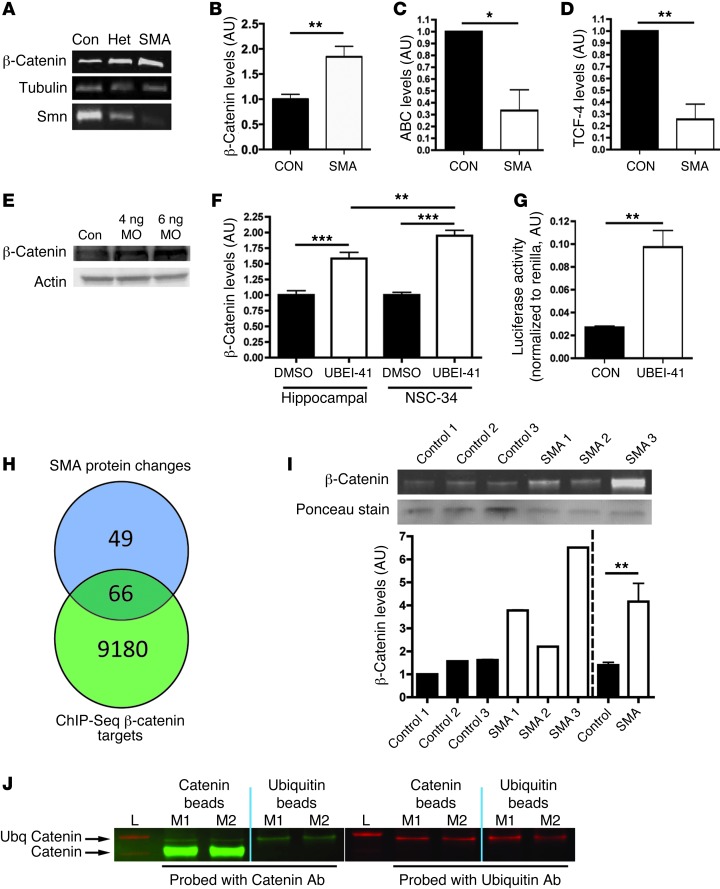
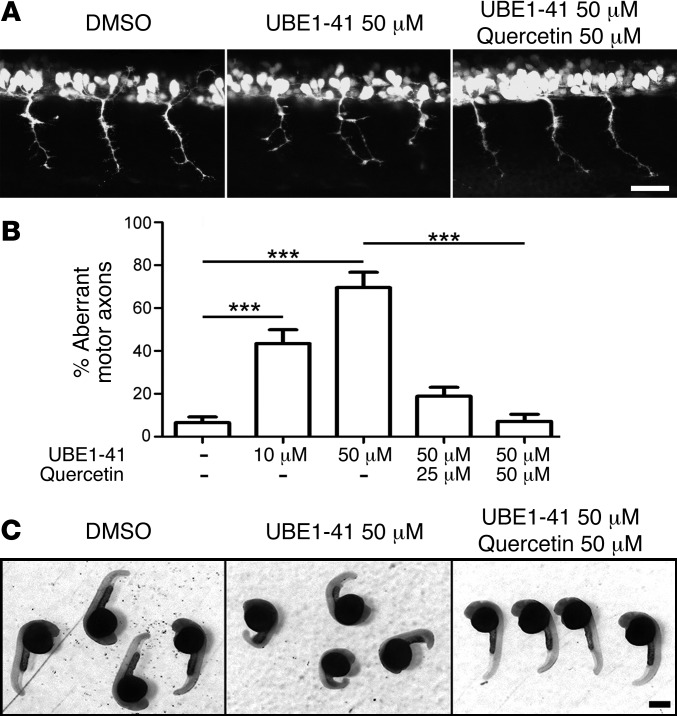
The autosomal recessive neurodegenerative disease spinal muscular atrophy (SMA) results from low levels of survival motor neuron (SMN) protein; however, it is unclear how reduced SMN promotes SMA development. Here, we determined that ubiquitin-dependent pathways regulate neuromuscular pathology in SMA. Using mouse models of SMA, we observed widespread perturbations in ubiquitin homeostasis, including reduced levels of ubiquitin-like modifier activating enzyme 1 (UBA1). SMN physically interacted with UBA1 in neurons, and disruption of Uba1 mRNA splicing was observed in the spinal cords of SMA mice exhibiting disease symptoms. Pharmacological or genetic suppression of UBA1 was sufficient to recapitulate an SMA-like neuromuscular pathology in zebrafish, suggesting that UBA1 directly contributes to disease pathogenesis. Dysregulation of UBA1 and subsequent ubiquitination pathways led to β-catenin accumulation, and pharmacological inhibition of β-catenin robustly ameliorated neuromuscular pathology in zebrafish, Drosophila, and mouse models of SMA. UBA1-associated disruption of β-catenin was restricted to the neuromuscular system in SMA mice; therefore, pharmacological inhibition of β-catenin in these animals failed to prevent systemic pathology in peripheral tissues and organs, indicating fundamental molecular differences between neuromuscular and systemic SMA pathology. Our data indicate that SMA-associated reduction of UBA1 contributes to neuromuscular pathogenesis through disruption of ubiquitin homeostasis and subsequent β-catenin signaling, highlighting ubiquitin homeostasis and β-catenin as potential therapeutic targets for SMA.


Figures

Figure 1
Figure 1. Perturbations in UBA1 levels and ubiquitin homeostasis in mouse and Drosophila models of SMA.
(AC) Significant reduction in levels of UBA1 protein in spinal cord and skeletal muscle from severe SMA mice at P5 compared with littermate controls (con), quantified using fluorescent Western blot (n = 3 mice/genotype; unpaired 2-tailed t test). (DF) Reduced levels of both monomeric and multimeric ubiquitin in the spinal cord of Taiwanese SMA mice at P10 (tubulin: loading control; n = 3 mice/genotype). (G) Representative confocal micrographs of striated muscle from WT and SMA Drosophila larvae immunolabeled with an antibody that recognizes mono- and polyubiquitinated proteins (green). Diffuse staining in muscle and muscle nuclei (stained with Hoechst, blue) of WT flies contrasted with a distinct lack of nuclear staining and increased perinuclear staining in SMA flies. Each panel in G is 75 μm in length. (H and I) UBA1 (green) and NeuN (red) immunolabeling of motor neurons from Taiwanese SMA and littermate control mouse spinal cords at P3 (H) and P7 (I). Note how UBA1 was predominantly cytoplasmic at P3 but nuclear at P7. Scale bars: 10 μm. (J) Significant increase in the ratio of nuclear to cytoplasmic UBA1 in SMA motor neurons at P7 compared with littermate controls (n = 24 motor neurons per genotype). (K) UBA1 levels in whole spinal cord of Taiwanese SMA mice remained unchanged at P3 and P7, but were significantly reduced by P10 (n > 3 mice per time point/genotype; ANOVA with Tukey’s post-hoc test). (L) Levels of UBA1 in skeletal muscle were significantly reduced at an early symptomatic age (P7) in Taiwanese SMA mice (n = 4 mice per genotype). *P < 0.05; **P < 0.01; ***P < 0.001.
Figure 2
Figure 2. UBA1 physically interacts with SMN protein in vivo, and Uba1 splicing is dysregulated at late symptomatic time points in SMA mouse spinal cord.
(A) No change in levels of Uba1 mRNA (or a control mRNA, Fth1; similar control data using Mapt not shown) in the spinal cord of P5 severe SMA mice, quantified using qPCR (n = 3 mice per genotype; ANOVA with Tukey’s post hoc test). (B) Representative fluorescent Western blots for SMN (left lane) and UBA1 (right lane) from co-IP experiments on spinal cord extracts from WT mice, using SMN-bound beads, demonstrating that UBA1 physically interacts with SMN in vivo. (C) Graphic overview of the exon structure of Uba1. Two Uba1 splice variants are generated with unique first exons. The position of primers used to amplify each splice variant is highlighted. Note that the coding sequence of Uba1 starts in exon 2. (DF) Bar charts showing relative expression levels of Uba1a and Uba1b, as well as the ratio of Uba1a to Uba1b, in SMA (Taiwanese) and control spinal cord at P3 (D; presymptomatic), P7 (E; early symptomatic), and P11 (late-symptomatic) (n = 3 mice per genotype, 3 independent amplifications per sample; 2-tailed, unpaired t tests). Uba1 splicing was significantly dysregulated in the late-symptomatic mice. **P < 0.01; ***P < 0.001.
Figure 3
Figure 3. Genetic and pharmacological suppression of uba1 in zebrafish leads to dose-dependent motor axon pathology.
(A) Representative fluorescence micrographs of motor axons growing out from the spinal cord in a control zebrafish 34 hours after fertilization, and in animals injected with either 4 ng or 6 ng of a MO suppressing uba1 levels (see Supplemental Figure 4). (B) Representative higher-magnification confocal micrographs showing abnormal sprouts and axonal extensions in motor axons from MO-treated zebrafish. Scale bars: 50 μm. (C) Dose-dependent increase in the occurrence of abnormal branching in MO-treated zebrafish (Kruskal-Wallis test with Dunn’s post hoc test; uninjected, n = 310 motor neurons, n = 31 animals; 4 ng, n = 360, n = 36 animals; 6 ng, n = 360, n = 36 animals). Only motor axons with modest (type 2; see Supplemental Figure 4) or severely abnormal branching (type 3; see Supplemental Figure 4) were quantified as having abnormal branching. (D) Representative confocal micrographs showing perturbations in motor axon morphology in Tg(hb9:gfp) zebrafish embryos treated with 50 μM of the UBA1 inhibitor UBEI-41. Note the presence of a “double-exit” motor axon (right hand side of image) in the UBEI-41 example, with the axon branch emerging on the right side of the pair showing stunted outgrowth. Scale bars: 100 μm; 30 μm (B, D). (E) Levels of abnormal motor axon branching and axon outgrowth in UBEI-41–treated zebrafish. Note the dose-dependent increase of numbers of aberrant motor axons in the UBEI-41 group compared with DMSO controls (10 μM UBEI-41 n = 258 nerves, n = 11 animals; 50 μM UBEI-41 n = 280 nerves n = 12 animals; Kruskal-Wallis test with Dunn’s post hoc test). ***P < 0.001.
Figure 4
Figure 4. β-Catenin is a downstream target of UBA1 and accumulates in SMA.
(A) β-Catenin and SMN protein in spinal cord of severe SMA, heterozygous (Het), and littermate (con) mice at P5 (tubulin: loading control). (BD) β-Catenin was increased in P10 Taiwanese SMA mouse spinal cord (n = 3 control mice, n = 4 SMA; unpaired 2-tailed t test), whereas stabilized β-catenin (ABC; C) and TCF-4, a β-catenin interacting protein required for activation (D), were both reduced (n = 3 CON, n = 3 SMA). (E) Increased β-catenin protein in zebrafish injected with 4 ng or 6 ng of a uba1 MO 48 hours after fertilization. (F) Increased β-catenin in rat hippocampal neurons and a motor neuron cell line (NSC-34) treated with 50 μM UBEI-41 (ANOVA with Tukey’s post-hoc test; n = 12 coverslips DMSO, n = 15 UBEI-41 hippocampal; n = 19 DMSO, n = 18 UBEI-41 NSC-34). (G) Increased β-catenin signaling activity in NSC-34 cells treated with 50 μM UBEI-41 measured with a luciferase reporter construct (n = 3 coverslips per treatment). (H) The majority of proteins modified in SMA synapses (66 out of 115 analyzed; see Supplemental Tables 1 and 2) are known β-catenin target genes identified by ChIP-Seq analyses. (I) Increased β-catenin protein in muscle biopsies from 3 human SMA patients (pooled data on right of dotted line). (J) Western blots for β-catenin (left panel; green) and ubiquitin (right panel; red) from co-IP experiments on synaptic extracts from 2 WT mice (L, ladder; M1, mouse 1; M2, mouse 2). Immunoblotting on the bound extract revealed the presence of ubiquitinated β-catenin (upper arrow). *P < 0.05; **P < 0.01; ***P < 0.001.
Figure 5
Figure 5. Rescue of uba1-dependent motor axon defects in zebrafish by pharmacological inhibition of β-catenin signaling.
(A) Representative confocal micrographs showing 3 segments of Tg(hb9:gfp) zebrafish embryos from the trunk region. Note the severe branching phenotype of the motor nerves in the UBEI-41–treated animal. This phenotype was rescued by quercetin treatment. Scale bar: 30 μm. (B) Dose-dependent increase in numbers of aberrant motor axons in the UBEI-41–treated group compared with DMSO controls. This phenotype was rescued by quercetin in a dose-dependent manner (DMSO controls: n = 331 nerves, n = 14 animals; 10 μM UBEI-41: n = 258, n = 11; 50 μM UBEI-41 n = 280, n = 12; 50 μM UBEI-41 + 25 μM quercetin: n = 143, n = 6; 50 μM UBEI-41 + 50 μM quercetin: n = 168, n = 7; Kruskal-Wallis test with Dunn’s post hoc test). (C) Representative overview images showing body axis defects in zebrafish embryos after UBEI-41 treatment compared with DMSO controls. Note the rescue of this gross phenotype following application of 50 μM quercetin. ***P < 0.001.
Figure 6
Figure 6. Amelioration of neuromuscular pathology in zebrafish and Drosophila models of SMA following pharmacological inhibition of β-catenin signaling.
(A) Representative confocal micrographs of motor axons growing out from the spinal cord in a SMA zebrafish 34 hours after fertilization (top panel) as well as an SMA zebrafish treated with 50 μM quercetin (bottom panel). Note the abnormal outgrowth and branching of motor axons in SMA zebrafish absent in the SMA zebrafish treated with quercetin. Scale bar: 100 μm. (B and C) Significant improvement in the number of truncated motor axons (B) and abnormally branched motor axons (C) in SMA zebrafish treated with 50 μM quercetin (Kruskal-Wallis test with Dunn’s post hoc test; n = 31 animals, control; n = 32 SMA; n = 30 SMA + 50 μM quercetin). (D) Representative confocal micrographs of NMJs in WT Drosophila (w1118), SMA Drosophila without quercetin, and SMA Drosophila fed 50 μM quercetin. NMJs were stained with anti-HRP to visualize axons and anticysteine string protein to identify synaptic boutons. Scale bar: 10 μm. (E and F) Feeding SMA Drosophila 50 μM quercetin restored bouton size (E) and rescued synaptic overgrowth (F) (n = 8 larvae per treatment; ANOVA with Tukey’s post test). *P < 0.05; **P < 0.01; ***P < 0.001.
Figure 7
Figure 7. Pharmacological inhibition of β-catenin ameliorates neuromuscular, but not systemic, pathology in SMA mice.
(A) Significant improvement on the righting test in early (P6) and late-symptomatic (P9) Taiwanese SMA mice (KO) treated with 10 mg/kg quercetin (Kruskal-Wallis test with Dunn’s post hoc; P3, n = 30 tests Het; n = 27 KO; n = 21 KOQ; P6, n = 31, Het; n = 28 KO; n = 27 KOQ; P9, n = 32, Het; n = 27 KO; n = 36 KOQ). (B and C) Reduced motor neuron loss from spinal cord of quercetin-treated SMA mice at P10. (D) Untreated (left) and a quercetin-treated (right) SMA mice at P10. (E and F) Amelioration of skeletal muscle fibre atrophy in the levator auris longus (LAL) muscle of quercetin-treated SMA mice at P10 (n = 8 muscles Het, n = 9 KO, n = 4 KOQ). (G and H) Reduced NMJ pathology (average number of axonal inputs per NMJ; multiply innervated NMJs are indicated by arrows) in the LAL muscle of quercetin-treated SMA mice at P10 (n = 8 muscles Het, n = 9 KO, n = 4 KOQ). (I) Survival curve for quercetin-treated SMA mice showing no significant difference compared with DMSO-treated controls (P = 0.9897, χ2 test; n = 10 mice DMSO; n = 13 quercetin). (J) Hearts (top) and livers (bottom) from control, SMA (KO DMSO), and quercetin-treated SMA (KO quercetin) mice at P10 showing no improvement in gross pathology. (K and L) UBA1 levels were reduced in all tissues from SMA mice at P10,but β-catenin levels were only correspondingly increased in spinal cord (n > 3 mice per genotype; ANOVA with Tukey’s post-hoc). Scale bars: 200 μm (B), 25 μm (E and G), 5 mm (J). *P < 0.05; **P < 0.01; ***P < 0.001.

Similar articles

Cited by

References

    1. Lefebvre S, et al. Identification and characterization of a spinal muscular atrophy-determining gene. Cell. 1995;80(1):155–165. doi: 10.1016/0092-8674(95)90460-3. - DOI - PubMed
    1. Wirth B. An update of the mutation spectrum of the survival motor neuron gene (SMN1) in autosomal recessive spinal muscular atrophy (SMA). Hum Mutat. 2000;15(3):228–237. doi: 10.1002/(SICI)1098-1004(200003)15:3<228::AID-HUMU3>3.0.CO;2-9. - DOI - PubMed
    1. Burghes AH, Beattie CE. Spinal muscular atrophy: why do low levels of survival motor neuron protein make motor neurons sick? Nat Rev Neurosci. 2009;10(8):597–609. - PMC - PubMed
    1. Mutsaers CA, et al. Reversible molecular pathology of skeletal muscle in spinal muscular atrophy. Hum Mol Genet. 2011;20(22):4334–4344. doi: 10.1093/hmg/ddr360. - DOI - PubMed
    1. Murray LM, Comley LH, Thomson D, Parkinson N, Talbot K, Gillingwater TH. Selective vulnerability of motor neurons and dissociation of pre- and post-synaptic pathology at the neuromuscular junction in mouse models of spinal muscular atrophy. Hum Mol Genet. 2008;17(7):949–962. doi: 10.1093/hmg/ddm367. - DOI - PubMed

Publication types

MeSH terms