RNA CoMPASS: a dual approach for pathogen and host transcriptome analysis of RNA-seq datasets
- PMID: 24586784
- PMCID: PMC3934900
- DOI: 10.1371/journal.pone.0089445
RNA CoMPASS: a dual approach for pathogen and host transcriptome analysis of RNA-seq datasets
Abstract
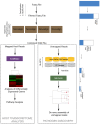
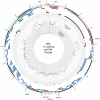
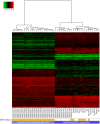
High-throughput RNA sequencing (RNA-seq) has become an instrumental assay for the analysis of multiple aspects of an organism's transcriptome. Further, the analysis of a biological specimen's associated microbiome can also be performed using RNA-seq data and this application is gaining interest in the scientific community. There are many existing bioinformatics tools designed for analysis and visualization of transcriptome data. Despite the availability of an array of next generation sequencing (NGS) analysis tools, the analysis of RNA-seq data sets poses a challenge for many biomedical researchers who are not familiar with command-line tools. Here we present RNA CoMPASS, a comprehensive RNA-seq analysis pipeline for the simultaneous analysis of transcriptomes and metatranscriptomes from diverse biological specimens. RNA CoMPASS leverages existing tools and parallel computing technology to facilitate the analysis of even very large datasets. RNA CoMPASS has a web-based graphical user interface with intrinsic queuing to control a distributed computational pipeline. RNA CoMPASS was evaluated by analyzing RNA-seq data sets from 45 B-cell samples. Twenty-two of these samples were derived from lymphoblastoid cell lines (LCLs) generated by the infection of naïve B-cells with the Epstein Barr virus (EBV), while another 23 samples were derived from Burkitt's lymphomas (BL), some of which arose in part through infection with EBV. Appropriately, RNA CoMPASS identified EBV in all LCLs and in a fraction of the BLs. Cluster analysis of the human transcriptome component of the RNA CoMPASS output clearly separated the BLs (which have a germinal center-like phenotype) from the LCLs (which have a blast-like phenotype) with evidence of activated MYC signaling and lower interferon and NF-kB signaling in the BLs. Together, this analysis illustrates the utility of RNA CoMPASS in the simultaneous analysis of transcriptome and metatranscriptome data. RNA CoMPASS is freely available at http://rnacompass.sourceforge.net/.
Conflict of interest statement
Figures


Similar articles
-
SPARTA: Simple Program for Automated reference-based bacterial RNA-seq Transcriptome Analysis.BMC Bioinformatics. 2016 Feb 4;17:66. doi: 10.1186/s12859-016-0923-y. BMC Bioinformatics. 2016. PMID: 26847232 Free PMC article.
-
In Silico HLA Typing Using Standard RNA-Seq Sequence Reads.Methods Mol Biol. 2015;1310:247-58. doi: 10.1007/978-1-4939-2690-9_20. Methods Mol Biol. 2015. PMID: 26024640
-
UTAP: User-friendly Transcriptome Analysis Pipeline.BMC Bioinformatics. 2019 Mar 25;20(1):154. doi: 10.1186/s12859-019-2728-2. BMC Bioinformatics. 2019. PMID: 30909881 Free PMC article.
-
Differential Expression Analysis of RNA-seq Reads: Overview, Taxonomy, and Tools.IEEE/ACM Trans Comput Biol Bioinform. 2020 Mar-Apr;17(2):566-586. doi: 10.1109/TCBB.2018.2873010. Epub 2018 Oct 1. IEEE/ACM Trans Comput Biol Bioinform. 2020. PMID: 30281477 Review.
-
Elucidating the editome: bioinformatics approaches for RNA editing detection.Brief Bioinform. 2019 Mar 22;20(2):436-447. doi: 10.1093/bib/bbx129. Brief Bioinform. 2019. PMID: 29040360 Review.
Cited by
-
PhytoPipe: a phytosanitary pipeline for plant pathogen detection and diagnosis using RNA-seq data.BMC Bioinformatics. 2023 Dec 13;24(1):470. doi: 10.1186/s12859-023-05589-2. BMC Bioinformatics. 2023. PMID: 38093207 Free PMC article.
-
Profiling of Microbial Landscape in Lung of Chronic Obstructive Pulmonary Disease Patients Using RNA Sequencing.Int J Chron Obstruct Pulmon Dis. 2023 Nov 10;18:2531-2542. doi: 10.2147/COPD.S426260. eCollection 2023. Int J Chron Obstruct Pulmon Dis. 2023. PMID: 38022823 Free PMC article.
-
RNA-seq data science: From raw data to effective interpretation.Front Genet. 2023 Mar 13;14:997383. doi: 10.3389/fgene.2023.997383. eCollection 2023. Front Genet. 2023. PMID: 36999049 Free PMC article. Review.
-
Computational Studies of the Intestinal Host-Microbiota Interactome.Computation (Basel). 2015 Mar;3(1):2-28. doi: 10.3390/computation3010002. Epub 2015 Jan 14. Computation (Basel). 2015. PMID: 34765258 Free PMC article.
-
Assessment of viral RNA in idiopathic pulmonary fibrosis using RNA-seq.BMC Pulm Med. 2020 Apr 3;20(1):81. doi: 10.1186/s12890-020-1114-1. BMC Pulm Med. 2020. PMID: 32245461 Free PMC article.
References
-
- Coco JR, EK Flemington, CM Taylor (2011) PARSES: A Pipeline for Analysis of RNA-Seq Exogenous Sequences. Proceedings of the ISCA 3rd International Conference on Bioinformatics and Computational Biology. Holiday Inn Downtown-Superdome, New Orleans, Louisiana, USA 2011: BICoB-2011. pp. 196–200.
-
- Weber G, Shendure J, Tanenbaum DM, Church GM, Meyerson M (2002) Identification of foreign gene sequences by transcript filtering against the human genome. Nat Genet 30: 141–142. - PubMed
Publication types
MeSH terms
Substances
Grants and funding
LinkOut - more resources
Full Text Sources
Other Literature Sources
Research Materials

