Sorbitol dehydrogenase overexpression and other aspects of dysregulated protein expression in human precancerous colorectal neoplasms: a quantitative proteomics study
- PMID: 24567419
- PMCID: PMC4014279
- DOI: 10.1074/mcp.M113.035105
Sorbitol dehydrogenase overexpression and other aspects of dysregulated protein expression in human precancerous colorectal neoplasms: a quantitative proteomics study
Abstract
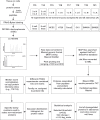
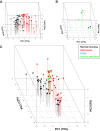
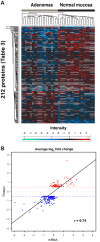
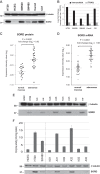
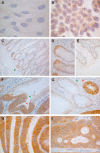
Colorectal adenomas are cancer precursor lesions of the large bowel. A multitude of genomic and epigenomic changes have been documented in these preinvasive lesions, but their impact on the protein effectors of biological function has not been comprehensively explored. Using shotgun quantitative MS, we exhaustively investigated the proteome of 30 colorectal adenomas and paired samples of normal mucosa. Total protein extracts were prepared from these tissues (prospectively collected during colonoscopy) and from normal (HCEC) and cancerous (SW480, SW620, Caco2, HT29, CX1) colon epithelial cell lines. Peptides were labeled with isobaric tags (iTRAQ 8-plex), separated via OFFGEL electrophoresis, and analyzed by means of LC-MS/MS. Nonredundant protein families (4325 in tissues, 2017 in cell lines) were identified and quantified. Principal component analysis of the results clearly distinguished adenomas from normal mucosal samples and cancer cell lines from HCEC cells. Two hundred and twelve proteins displayed significant adenoma-related expression changes (q-value < 0.02, mean fold change versus normal mucosa ±1.4), which correlated (r = 0.74) with similar changes previously identified by our group at the transcriptome level. Fifty-one (∼25%) proteins displayed directionally similar expression changes in colorectal cancer cells (versus HCEC cells) and were therefore attributed to the epithelial component of adenomas. Although benign, adenomas already exhibited cancer-associated proteomic changes: 69 (91%) of the 76 protein up-regulations identified in these lesions have already been reported in cancers. One of the most striking changes involved sorbitol dehydrogenase, a key enzyme in the polyol pathway. Validation studies revealed dramatically increased sorbitol dehydrogenase concentrations and activity in adenomas and cancer cell lines, along with important changes in the expression of other enzymes in the same (AKR1B1) and related (KHK) pathways. Dysregulated polyol metabolism might represent a novel facet of metabolome remodeling associated with tumorigenesis.
Figures

Similar articles
-
A quantitative proteomic approach of the different stages of colorectal cancer establishes OLFM4 as a new nonmetastatic tumor marker.Mol Cell Proteomics. 2011 Dec;10(12):M111.009712. doi: 10.1074/mcp.M111.009712. Epub 2011 Oct 10. Mol Cell Proteomics. 2011. PMID: 21986994 Free PMC article.
-
Targeted Proteomics for Multiplexed Verification of Markers of Colorectal Tumorigenesis.Mol Cell Proteomics. 2017 Mar;16(3):407-427. doi: 10.1074/mcp.M116.062273. Epub 2017 Jan 4. Mol Cell Proteomics. 2017. PMID: 28062797 Free PMC article.
-
Proteome analysis of formalin-fixed paraffin-embedded colorectal adenomas reveals the heterogeneous nature of traditional serrated adenomas compared to other colorectal adenomas.J Pathol. 2020 Mar;250(3):251-261. doi: 10.1002/path.5366. Epub 2019 Dec 15. J Pathol. 2020. PMID: 31729028
-
In-Depth Proteomic Analysis of Paraffin-Embedded Tissue Samples from Colorectal Cancer Patients Revealed TXNDC17 and SLC8A1 as Key Proteins Associated with the Disease.J Proteome Res. 2024 Nov 1;23(11):4802-4820. doi: 10.1021/acs.jproteome.3c00749. Epub 2024 Oct 23. J Proteome Res. 2024. PMID: 39441737
-
Fructose Metabolism in Cancer.Cells. 2020 Dec 8;9(12):2635. doi: 10.3390/cells9122635. Cells. 2020. PMID: 33302403 Free PMC article. Review.
Cited by
-
Serum Sorbitol Dehydrogenase as a Novel Prognostic Factor for Hepatocellular Carcinoma after Surgical Resection.Cancers (Basel). 2021 Dec 6;13(23):6143. doi: 10.3390/cancers13236143. Cancers (Basel). 2021. PMID: 34885252 Free PMC article.
-
Aldo-keto reductases: Role in cancer development and theranostics.Oncol Res. 2024 Jul 17;32(8):1287-1308. doi: 10.32604/or.2024.049918. eCollection 2024. Oncol Res. 2024. PMID: 39055885 Free PMC article. Review.
-
Effect of aberrant fructose metabolism following SARS-CoV-2 infection on colorectal cancer patients' poor prognosis.PLoS Comput Biol. 2024 Sep 27;20(9):e1012412. doi: 10.1371/journal.pcbi.1012412. eCollection 2024 Sep. PLoS Comput Biol. 2024. PMID: 39331675 Free PMC article.
-
Metabolomic Prediction of Human Prostate Cancer Aggressiveness: Magnetic Resonance Spectroscopy of Histologically Benign Tissue.Sci Rep. 2018 Mar 26;8(1):4997. doi: 10.1038/s41598-018-23177-w. Sci Rep. 2018. PMID: 29581441 Free PMC article.
-
Role of aldo-keto reductase family 1 member B1 (AKR1B1) in the cancer process and its therapeutic potential.J Cell Mol Med. 2020 Aug;24(16):8890-8902. doi: 10.1111/jcmm.15581. Epub 2020 Jul 6. J Cell Mol Med. 2020. PMID: 32633024 Free PMC article. Review.
References
-
- Jemal A., Bray F., Center M. M., Ferlay J., Ward E., Forman D. (2011) Global cancer statistics. CA Cancer J. Clin. 61, 69–90 - PubMed
-
- Siegel R., Naishadham D., Jemal A. (2013) Cancer statistics, 2013. CA Cancer J. Clin. 63, 11–30 - PubMed
-
- Cattaneo E., Baudis M., Buffoli F., Bianco M. A., Zorzi F., Marra G. (2011) Pathways and crossroads to colorectal cancer In Pre-Invasive Disease: Pathogenesis and Clinical Management (Fitzgerald R. C., ed), pp. 369–394, Springer, New York
-
- U.S. Multi-Society Task Force (2002) Screening for colorectal cancer: recommendation and rationale. Ann. Intern. Med. 137, 129–131 - PubMed
Publication types
MeSH terms
Substances
LinkOut - more resources
Full Text Sources
Other Literature Sources
Medical
Molecular Biology Databases
Research Materials

