. 2014 Apr;17(4):522-32.
doi: 10.1038/nn.3657. Epub 2014 Feb 23.

Palmitoylation of δ-catenin by DHHC5 mediates activity-induced synapse plasticity

Affiliations

Palmitoylation of δ-catenin by DHHC5 mediates activity-induced synapse plasticity

G Stefano Brigidi et al. Nat Neurosci. 2014 Apr.

Abstract

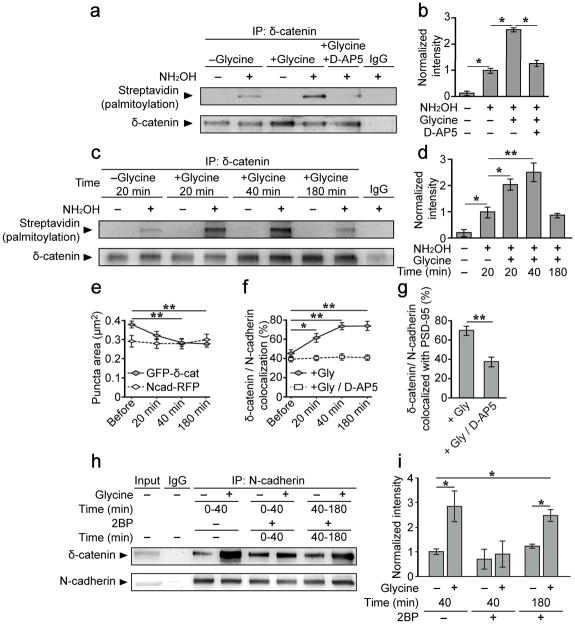
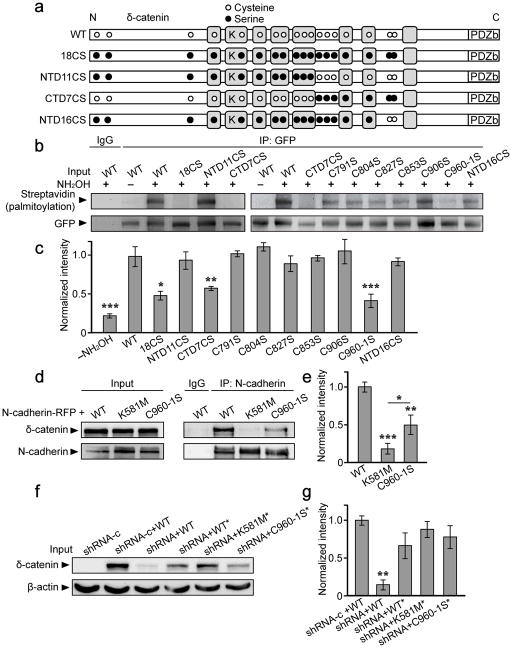
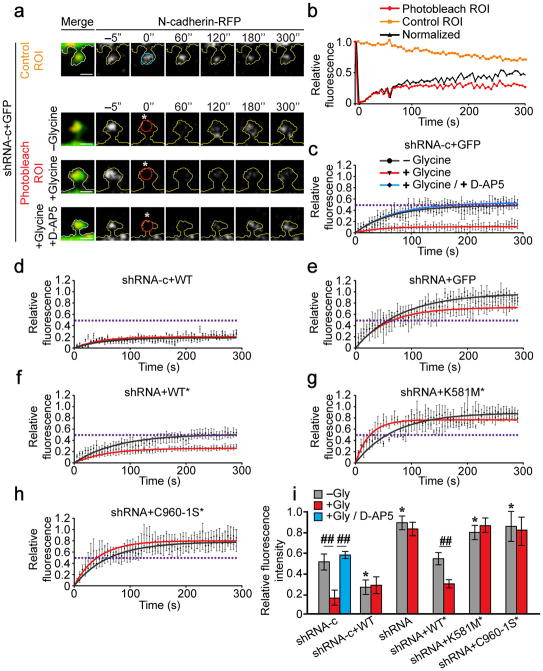
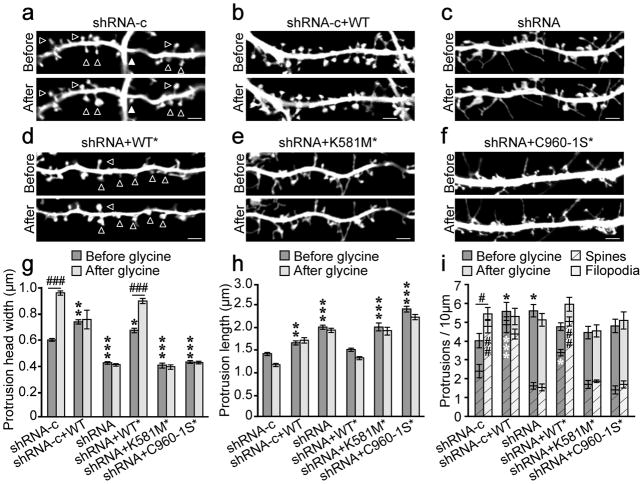
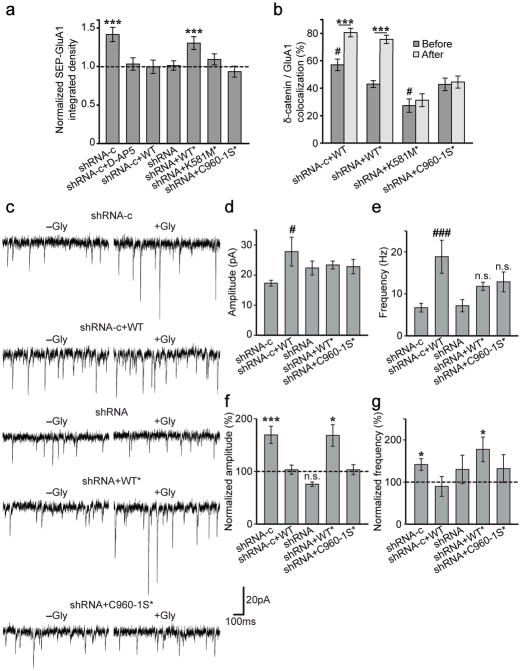
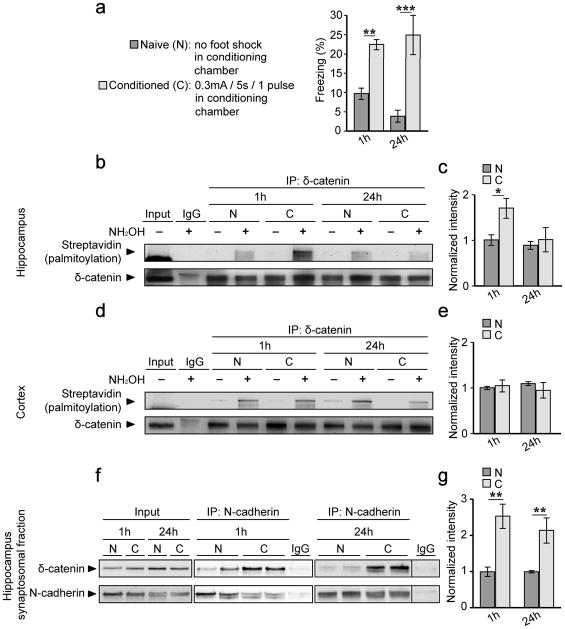
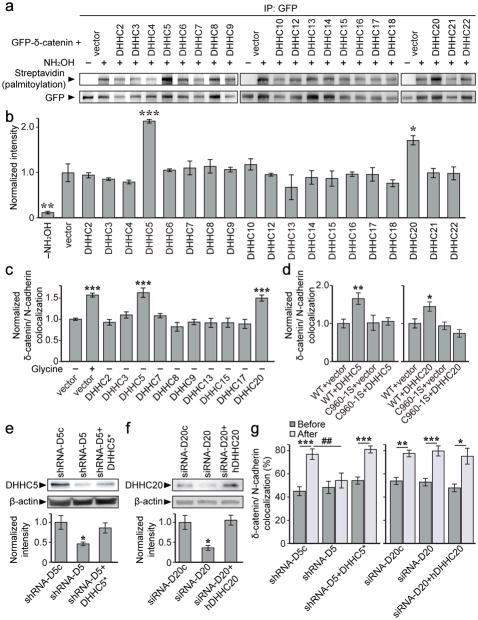
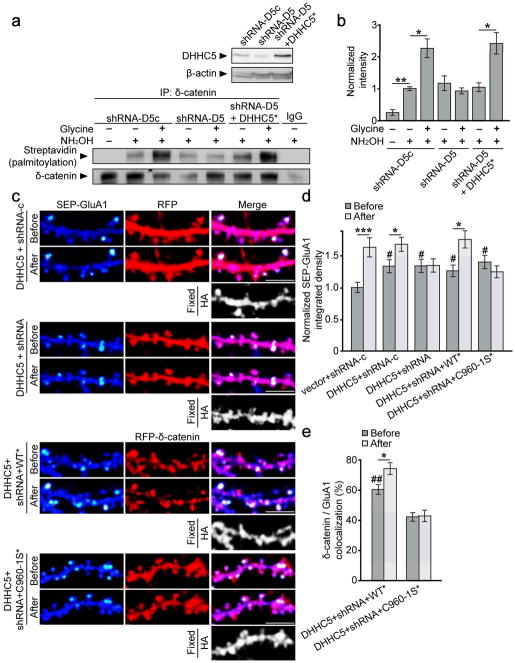
Synaptic cadherin adhesion complexes are known to be key regulators of synapse plasticity. However, the molecular mechanisms that coordinate activity-induced modifications in cadherin localization and adhesion and the subsequent changes in synapse morphology and efficacy remain unknown. We demonstrate that the intracellular cadherin binding protein δ-catenin is transiently palmitoylated by DHHC5 after enhanced synaptic activity and that palmitoylation increases δ-catenin-cadherin interactions at synapses. Both the palmitoylation of δ-catenin and its binding to cadherin are required for activity-induced stabilization of N-cadherin at synapses and the enlargement of postsynaptic spines, as well as the insertion of GluA1 and GluA2 subunits into the synaptic membrane and the concomitant increase in miniature excitatory postsynaptic current amplitude. Notably, context-dependent fear conditioning in mice resulted in increased δ-catenin palmitoylation, as well as increased δ-catenin-cadherin associations at hippocampal synapses. Together these findings suggest a role for palmitoylated δ-catenin in coordinating activity-dependent changes in synaptic adhesion molecules, synapse structure and receptor localization that are involved in memory formation.


Figures

Figure 1
Figure 1. δ-catenin palmitoylation and its association with synaptic N-cadherin is increased following activity
(a–d) ABE chemistry and western blotting for streptavidin-HRP was used to determine palmitoylation of immunoprecipitated proteins. Omission of NH2OH controlled for non-specific incorporation of biotin. (a, b) δ-catenin palmitoylation increased 40 min after glycine treatment but not glycine+D-AP5 (50μM; n=4, p=0.017, F2,9=6.59). (c, d) δ-catenin palmitoylation peaked at 40 mins and returned to baseline 180 mins after glycine treatment (n=4, p=0.001, F4,10=19.01). (e–g) 14 DIV hippocampal neurons transfected with GFP-δ-catenin and N-cadherin-RFP were imaged immediately before and 20, 40 and 180 min after glycine treatment, and stained for PSD-95 post hoc. (e) Glycine treatment decreased the area of GFP-δ-catenin (GFP-δ-catenin: n=19, p<0.001, F3,18=10.26; N-cadherin-RFP: n=19, p=0.476, F3,18=21.69), (f) increased δ-catenin/N-cadherin colocalization (Glycine: n=19, p<0.001, F3,18=4.171; Glycine+D-AP5: n=9, p=0.755, F3,8=0.399) and (g) increased the colocalization of δ-catenin/N-cadherin with PSD-95, compared to cells treated with glycine+D-AP5 (n=19, 9, p=0.001, student’s t-test). (h, i) δ-catenin/N-cadherin interactions were enhanced 40 min following glycine treatment, and abolished when 2-bromopalmitate (2BP, 50μM) was applied from 0 to 40 min, but not from 40–180 min, after stimulation (n=7, p=0.007, F5,24=4.15). n values indicate (b, d, i) the number of separate blots from separate cell cultures, or (e–g) the number of cells from 3 separate cultures. Graphs show mean ± SEM. (b, d, i) *p<0.05, **p<0.01; one-way ANOVA; Tukey’s test post hoc. (e, f) *p<0.05, **p<0.01; repeated measures one-way ANOVA, Tukey’s test post hoc; (g) **p<0.01; student’s t-test. Full length blots from (a, c, h) are presented in Supplementary Figure 6.
Figure 2
Figure 2. Palmitoylation of δ-catenin occurs at cysteines 960 and 961, and requires lysine 581 for binding to N-cadherin
(a) Schematic depiction of δ-catenin constructs, N-terminally tagged with GFP (not shown), and illustrating the approximate localization of all 18 cysteine residues (white circles), as well as cysteine to serine mutations (black circles). Lysine 581 (K) is located within the third Armadillo repeat domain (grey boxes), and the PDZ-binding motif (PDZb) at the C-terminus. (b, c) GFP-δ-catenin constructs were transfected into HEK293T cells for 36–48 hrs and lysates immunoprecipitated with anti-GFP. Following ABE labeling, blots were probed with anti-streptavidin to determine palmitoylation of the specified δ-catenin construct. (n=3–5 blots from separate cultures, p<0.001, F11,41=10.18). (d, e) HEK293T cells were transfected with the indicated GFP-tagged δ-catenin constructs plus N-cadherin-RFP, and lysates immunoprecipitated with anti-N-cadherin. (n=3, p<0.001, F2,6=32.87). (f, g) 293T cells were transfected with a control shRNA (shRNA-c) or δ-catenin shRNA, plus the indicated GFP-δ-catenin constructs (*denotes shRNA-resistance) (n=4, p=0.005, F4,13=6.41). The n value indicates the number of separate blots from separate cell cultures. *p<0.05, **p<0.01, ***p<0.001; one-way ANOVA, Tukey’s test post hoc. Full length blots from (b, d, f) are presented in Supplementary Figure 6.
Figure 3
Figure 3. δ-catenin palmitoylation is required for activity-induced stabilization of N-cadherin within dendritic spine heads
(a) Cells were photobleached at 0 s (”; white asterisk) within a 1μm diameter ROI. Fluorescence within a photobleached ROI (red circle) was normalized to non-photobleached ROI in adjacent spines (blue circle). Scale bar=1μm. (b) Fluorescence recovery within photobleached and non-photobleached ROIs (from top two panels in a) and the normalization for bleaching. (c–h) Normalized fluorescence recovery of N-cadherin-RFP. Dashed lines represent the plateau for fluorescence recovery in control cells (c). Points with error bars represent mean ± SEM, solid lines represent single exponential fit. Statistical tests compare plateau values from exponential fits ± SEM. Neurons were obtained from ≥ 3 separate cultures. (c) n=10 cells, −glycine; 15 cells, +glycine; n=5 cells, glycine+D-AP5; p=0.003, F2,27=7.15, one-way ANOVA. (d) n=11 cells, –glycine; 5 cells, +glycine; p=0.991; student’s t-test. (e) n=18 cells, −glycine; 8 cells, +glycine; p=0.099, student’s t-test). (f) n=18 cells, −glycine; 9 cells, +glycine; p=0.003, student’s t-test. (g) n=12 cells, −glycine; 9 cells, +glycine; p=0.223, student’s t-test. (h) n=25 cells, −glycine; 8 cells, +glycine; p=0.92, t-test. (i) The mobile fraction of N-cadherin-RFP (fluorescence within the ROI at the 5 min time point, normalized for photobleaching; mean ± SEM; p<0.001, F12,140=8.03; one-way ANOVA). *p<0.05, one-way ANOVA, Tukey’s test post hoc, relative to control cells expressing shRNA-c, in the absence of glycine; ##p<0.01, Tukey’s test post hoc, relative to same transfection condition in the absence of glycine.
Figure 4
Figure 4. δ-catenin palmitoylation is required for activity-induced spine remodeling
Primary dendrites were imaged before and again 40–60 min after glycine treatment. (a) n=12 cells, 803 spines; (b) n=7 cells, 396 spines; (c) n=10 cells, 529 spines, (d) n=10 cells, 606 spines; (e) n=8 cells, 352 spines; (f) n=10 cells, 535 spines. Scale bar=2μm. (g) Protrusion head width before and after glycine treatment (p<0.001, F5,6430=127.57 [between groups effect]; p<0.001, F1,6430=43.13 [glycine treatment effect]). (h) Length of protrusions before and after glycine treatment (p<0.001, F5,6430=213.45 [between groups effect]; p<0.001, F1,6430=11.57 [glycine treatment effect]. (i) The density of total protrusions (mean represented by crosshatched bars plus solid bars; top error bars represent total protrusion SEM; p=0.005, F5,102=2.23 [between groups effect]; p=0.04, F1,102=4.32 [glycine treatment effect]; two-way ANOVA), filopodia (solid bars), and spines (crosshatched bars ± SEM; p<0.001, F5,102=65.05 [between groups effect]; p<0.001, F5,102=18.71 [glycine treatment effect]; two-way ANOVA) before and after glycine treatment. Cells were obtained from ≥3 separate cultures. Graphs represent mean ± SEM. (g, h) *p<0.05, **p<0.01, ***p<0.001; two-way ANOVA, Bonferonni’s test post hoc, relative to shRNA-c before glycine treatment. ###p<0.001; Bonferonni’s test post hoc, relative to same condition before glycine. (i) *(black) above bars compare total protrusions relative to shRNA-c cells before glycine, *(white) within crosshatched bars compare spines relative to shRNA-c before glycine; # above bars compare total protrusions within groups before and after glycine, # within crosshatched bars compare spines within groups before and after glycine. #/*p<0.05, ##/**p<0.01, ***p<0.001 two-way ANOVA, Bonferonni’s test post-hoc.
Figure 5
Figure 5. δ-catenin palmitoylation is required for activity-induced AMPA receptor insertion and changes in mEPSCs
(a, b) Cells were imaged before and 40–60 min after indicated treatments. (a) Integrated density (IntDen) of pre-existing SEP-GluA1 puncta normalized to the same puncta before treatment (dashed line). Cell number and p values from paired t-tests: shRNA-c (n=22, p<0.001), shRNA-c+D-AP5 (n=9, p=0.91), shRNA-c+WT (n=9, p=0.865), shRNA (n=10, p=0.942), shRNA+WT* (n=14, p<0.001), shRNA+K581M* (n=13, p=0.133), and shRNA+C960-1S* (n=9, p=0.176). (b) Percent δ-catenin/GluA1 colocalization (p<0.001, F3,49=8.25; one-way ANOVA). Crosshatches denote significance among “before” groups relative to shRNA+WT*, asterisks denote significance within groups before and after glycine: shRNA-c+WT (n=12, p<0.001), shRNA+WT* (n=15, p<0.001), shRNA+K581M* (n=12, p=0.552), and shRNA+C960-1S* (n=14, p=0.494). (c–g) Whole-cell recordings (held at −65mV) 40 min after indicated treatments. (c) Representative mEPSC traces. (d) Basal mEPSC amplitude increased in shRNA-c+WT cells (p=0.031, F4,45=2.928, one-way ANOVA). (e) Basal mEPSC frequency was increased in shRNA-c+WT cells (p<0.001, F4,45=6.056; one-way ANOVA). (f, g) Percent mEPSC amplitude and frequency 40 min after glycine, normalized to the mean in untreated cells (dashed line). n values in −glycine or +glycine groups, and p values from student’s t-tests for amplitude and frequency, respectively: shRNA-c (n=17, 23; p<0.001; p=0.048), shRNA-c+WT* (n=9, 8; p=0.857; p=0.741), shRNA (n=9, 7, p=0.076; p=0.440), shRNA+WT* (n=7, 10; p=0.016; p=0.048), shRNA+960-1S* (n=8, 7; p=0.801; p=0.209). Graphs represent mean ± SEM. (a, b) *p<0.05, **p<0.01, ***p<0.001; paired t-test. #p<0.05, one-way ANOVA with Tukey’s test post hoc. (d–g) #p<0.05, ###p<0.001; one-way ANOVA, Tukey’s test post hoc. *p<0.05, ***p<0.001; student’s t-test.
Figure 6
Figure 6. Context-dependent fear conditioning increases δ-catenin palmitoylation and N-cadherin associations in the hippocampus
(a) 6–9 week old male mice exhibited increased freezing 1 hour (h) and 24 h following contextual fear conditioning (conditioned group, C) compared to mice which did not receive a foot shock (Naïve group, N) (n=10 mice per group, per timepoint; p<0.001, F1,36=35.89 [treatment effect]; p=0.539, F1,36=0.38 [timepoint effect]). Hippocampal (b, c) or cortical (d, e) lysates from naïve and conditioned mice were immunoprecipitated with anti-δ-catenin or IgG, and and palmitoylation levels determined using ABE chemistry. (b, c) Palmitoylation of δ-catenin is transiently increased in the hippocampus of conditioned mice (n=5 blots from 5 separate animals; p=0.034, F1,16=5.37 [treatment effect]; p=0.037, F1,16=5.17[timepoint effect]). (d, e) Palmitoylation levels of δ-catenin are similar in the cortex of naïve and conditioned mice (n=3 blots from 3 separate animals; p=0.463, F1,8=0.59 [treatment effect]; p=0.978, F1,8=0.1 [timepoint effect]). (f, g) P2 synaptosomes from hippocampal lysates were isolated and immunoprecipitated with anti-N-cadherin. There is an increase in δ-catenin bound to N-cadherin in the hippocampus of conditioned mice 1 h and 24 h after training. The IgG lane in the blot on the right was cropped from another position within the same blot. (n=3 and 5 blots from 3 and 5 separate animals 1 h, and 24 h post-training, respectively; p<0.001, F1,12=24.95 [treatment effect]; p=0.492, F1,12=0.50 [timepoint effect]). All graphs represent mean ± SEM. *p<0.05, **p<0.01, ***p<0.001, two-way ANOVA, Bonferroni’s test post hoc. Full length blots of those shown in (b, d, f) are presented in Supplementary Figure 6.
Figure 7
Figure 7. DHHC5 and 20 palmitoylate δ-catenin but activity-induced recruitment of δ-catenin to N-cadherin is mediated by DHHC5
(a, b) Palmitoylation of GFP-δ-catenin co-transfected with the indicated DHHC constructs in HEK293T cells (n=3–6 blots from separate cultures, p<0.001, F19,36=7.154). (c) Colocalization of GFP-δ-catenin and N-cadherin-RFP in cells expressing the indicated DHHCs (p<0.001, F11,834=15.4). Cell number from 3–10 cultures: vector –glycine (n=262), vector +glycine (n=200), DHHC2 (n=35), DHHC3 (n=47), DHHC5 (n=39), DHHC7 (n=31), DHHC8 (n=56), DHHC9 (n=49), DHHC13 (n=22), DHHC15 (n=18), DHHC17 (n=24), DHHC20 (n=63). (d) δ-catenin palmitoylation is essential for DHHC5 (p=0.004, F3,75=4.67) and DHHC20-induced (p=0.005, F3,86=6.559) clustering of δ-catenin/N-cadherin. Number of cells from 3 cultures: WT+vector (DHHC5 experiment; n=22), WT+DHHC5 (n=17), C960-1S+vector (n=20), C960-1S+DHHC5 (n=20), WT+vector (DHHC20 experiment; n=23), WT+DHHC20 (n=20), C960-1S+vector (n=12), C960-1S+DHHC20 (n=20). (e, f) RNAi-mediated knockdown of DHHC5 and DHHC20 in 6DIV hippocampal neurons. (e) n=5 blots from 5 cultures, p=0.022, F2,12=5.29 (*denotes shRNA-resistance). (f) n=3 blots from 3 cultures, p=0.019, F2,6=8.29 (hDHHC20 denotes human DHHC20). (g) Knockdown of DHHC5, but not DHHC20 abolished activity-induced increases in GFP-δ-catenin/N-cadherin-RFP colocalization. Cell number and p values from paired t-tests before/after activity: DHHC5 (p<0.001, F5,78=5.29, one-way ANOVA); shRNA-D5c (n=15, p<0.001), shRNA-D5 (n=13, p=0.288), shRNA-D5+DHHC5* (n=14, p<0.001). DHHC20: (p<0.001, F5,66=13.65, one-way ANOVA); siRNA-D20c (n=11, p=0.004), siRNA-D20 (n=13, p<0.001), siRNA-D20+hDHHC20 (n=12, p=0.012). Graphs represent mean ± SEM. (b–f) *p<0.05, **p<0.01, ***p<0.001, one-way ANOVA with Tukey’s test post hoc. (g) *p<0.05, **p<0.01, ***p<0.001, paired t-test; ##p<0.01, one-way ANOVA with Tukey’s test post hoc. Full length blots from (a, e, f) shown in Supplementary Figure 6.
Figure 8
Figure 8. DHHC5 is required for activity-induced palmitoylation of δ-catenin and surface AMPAR insertion
(a top) shRNA-D5 reduced DHHC5 levels at 12 DIV (shRNA-D5c[1.0 ± 0.13]: shRNA-D5 [0.62 ± 0.042], shRNA-D5+DHHC5* [0.89 ± 0.044]; one-way ANOVA, p=0.042, F2,6=5.57). (a bottom, b) Knockdown of DHHC5 abolishes activity-induced palmitoylation of δ-catenin (n=3 blots from 3 separate cultures, p=0.002, F6,14=10.03). (c) Confocal images of hippocampal neurons transfected with the indicated constructs before and 40–60 min after glycine treatment. SEP-fluorescent puncta are pseudocolored in heat maps. DHHC5-HA overexpression was confirmed by post hoc immunostaining for HA. Scale bar=5μm. (d) IntDen of SEP-GluA1 puncta, normalized to the same puncta before glycine treatment. n values indicate cell number from ≥3 separate cultures, and p values from paired t-tests: vector+shRNA-c (14, p<0.001), DHHC5+δ-catenin shRNA-c (15, p=0.006), DHHC5+δ-catenin shRNA (13, p=0.857), DHHC5+δ-catenin shRNA+δ-catenin WT* (16, p=0.002), and DHHC5+δ-catenin shRNA+δ-catenin C960-1S* (13, p=0.161). DHHC5 overexpression increased basal SEP-GluA1 IntDen (one-way ANOVA; p=0.001, F9,132=4.141). Crosshatches denote significance among “before” groups relative to vector+shRNA-c, asterisks denote significance within groups before and after glycine. (e) Colocalization of indicated δ-catenin constructs with GluA1 (one-way ANOVA; p<0.001, F3,54=19.29). Crosshatches denote significance among “before” groups relative to DHHC5+shRNA+C960-1S*. WT*/GluA1 colocalization increased following activity (paired t-test; p=0.005), whereas C960-1S*/GluA1 colocalization did not (paired t-test; p=0.741). Graphs represent mean ± SEM. (b) *p<0.05, one-way ANOVA with Tukey’s test post hoc. (d, e) *p<0.05, ***p<0.001, paired t-test; #p<0.05, ##p<0.01, one-way ANOVA with Tukey’s test post hoc. Full-length blots from (a) are presented in Supplementary Figure 6.

Similar articles

Cited by

References

    1. Bozdagi O, et al. Persistence of coordinated long-term potentiation and dendritic spine enlargement at mature hippocampal CA1 synapses requires N-cadherin. J Neurosci. 2010;30:9984–9989. - PMC - PubMed
    1. Mendez P, De Roo M, Poglia L, Klauser P, Muller D. N-cadherin mediates plasticity-induced long-term spine stabilization. J Cell Biol. 2010;189:589–600. - PMC - PubMed
    1. Bozdagi O, Shan W, Tanaka H, Benson DL, Huntley GW. Increasing numbers of synaptic puncta during late-phase LTP: N-cadherin is synthesized, recruited to synaptic sites, and required for potentiation. Neuron. 2000;28:245–259. - PubMed
    1. Tai CY, Mysore SP, Chiu C, Schuman EM. Activity-regulated N-cadherin endocytosis. Neuron. 2007;54:771–785. - PubMed
    1. Tang L, Hung CP, Schuman EM. A role for the cadherin family of cell adhesion molecules in hippocampal long-term potentiation. Neuron. 1998;20:1165–1175. - PubMed

Publication types

MeSH terms