. 2014:5:3349.
doi: 10.1038/ncomms4349.

Radial symmetry in a chimeric glutamate receptor pore

Affiliations

Radial symmetry in a chimeric glutamate receptor pore

Timothy J Wilding et al. Nat Commun. 2014.

Abstract

Ionotropic glutamate receptors comprise two conformationally different A/C and B/D subunit pairs. Closed channels exhibit fourfold radial symmetry in the transmembrane domain (TMD) but transition to twofold dimer-of-dimers symmetry for extracellular ligand binding and N-terminal domains. Here, to evaluate symmetry in open pores we analysed interaction between the Q/R editing site near the pore loop apex and the transmembrane M3 helix of kainate receptor subunit GluK2. Chimeric subunits that combined the GluK2 TMD with extracellular segments from NMDA receptors, which are obligate heteromers, yielded channels made up of A/C and B/D subunit pairs with distinct substitutions along M3 and/or Q/R site editing status, in an otherwise identical homotetrameric TMD. Our results indicate that Q/R site interaction with M3 occurs within individual subunits and is essentially the same for both A/C and B/D subunit conformations, suggesting that fourfold pore symmetry persists in the open state.


Figures
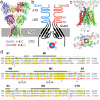
Figure 1
Figure 1. Glutamate receptor domain structure
(a) Chimaeric glutamate receptor homology model based on the homomeric GluA2 AMPA receptor closed state x-ray structure (Sobolevsky et al., 2009) illustrating the amino terminal domain (ATD), ligand-binding domain (LBD) and transmembrane domain (TMD). The cytoplasmic carboxy terminal domain (CTD) was not resolved or modeled. Each subunit is shown in a different color. In wild type NMDA receptors GluN1 and GluN2B subunits are in the A/C and B/D conformations, respectively. (b) Diagram of the four domains in 2 chimaeric subunits of a heteromeric receptor highlighting the pore loop and M1-M4 alpha helices in the TMD derived from KA receptor subunit GluK2 (white roman numerals I, II, III, IV). Left hand subunit is unedited (Q) at the apex of the pore loop and wild type L614 in M3 at the level of the central cavity. Right hand subunit is edited (R) and mutated (L614A) in M3. Subunits with N1 and N2B extracellular domains are presumed to be adjacent in functional tetramers (below), but for clarity are positioned opposite each other in the diagram. (c) Enlarged side and axial views of the homology model showing the lower portion of the LBD in faint teal (GluN1) and red (GluN2B), as well as the TMD and linkers from GluK2 in full color. The view down the central axis from the extracellular domains illustrates differences in the A/C and B/D linkers. (d) Sequence alignment for chimaeric GluN1 and GluN2B with GluK2. Green triangles indicate the position of joints in the chimaeric subunits. The purple triangle indicates an additional joint for subunits that only included the TMD from GluK2. Numbering is for the mature wild type proteins. Secondary structure is shown as cylinders (α-helices), arrows (β-strands) and lines (loops) in grey above the sequence. * indicates the Q/R/N site in the pore loop and the GluK2 L614A mutation site in M3. ◇ Indicates the M3 Ala at the middle of the bundle crossing. The W in M2 of GluN1 and the S in M3 of GluN2B that interact with each other (Siegler Retchless et al., 2012) are underlined.
Figure 2
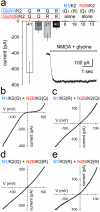
Figure 2. Whole-cell current and current-voltage relations for channels with kainate receptor pores
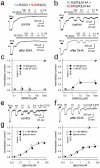
(a) Whole-cell current (mean ± s.e.m.) evoked by 10 μM NMDA plus 10 μM glycine in HEK 293 cells transfected with edited (R) or unedited (Q) N1/K2 and N2B/K2 chimaeric subunits. Agonist application did not elicit current in cells transfected with the N1/K2(Q/R) or N2B/K2(Q/R) subunits alone. Sample size is shown for each bar. (inset) Current recorded from a cell transfected with N1/K2(Q)+N2B/K2(Q). (b-e) Whole-cell currents evoked by 10 μM NMDA and 10 μM glycine as the membrane potential was ramped from −160 to +110 mV at 0.75 mv msec−1. (b) Bi-rectification of current mediated by N1/K2(Q)+N2B/K2(Q) reflects block by endogenous polyamines, as well as 20 μM spermine added to the internal solution, with relief of block as the polyamines permeate the channel at positive potentials. Polyamine block was eliminated by Arg substitution at the Q/R site of either the N1/K2 (c) or N2B/K2 (d) subunit, or both subunits (e).
Figure 3
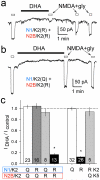
Figure 3. Selective DHA inhibition of fully edited chimaeric receptors
Whole-cell current evoked by 10 μM NMDA and 10 μM glycine (open bars) at −80 mV before and after exposure to 30 μM DHA (solid bar) in a cell transfected with fully edited N1/K2(R) + N2B/K2(R) subunits (a) and in a cell that received N1/K2(Q)+N2B/K2(R) (b). (c) Plot of current evoked immediately after exposure to DHA as a fraction of control current before DHA (mean ± s.e.m.) for the 4 chimaeric combinations and, for comparison, wild type homomeric GluK2(Q) and (R) and heteromeric GluK2(R)+GluK5(Q). Sample size is shown for each bar. * significantly different from N1/K2(Q)+N2B/K2(Q) and homomeric GluK2(Q) (P < 0.0001, one way ANOVA with post hoc Student-Newman-Keuls comparison).
Figure 4
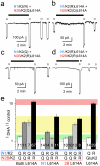
Figure 4. Intrasubunit interaction between the pore loop and M3 helix
Whole-cell current evoked by 10 μM NMDA and 10 μM glycine (open bars) at −80 mV before and after exposure to 30 μM DHA (solid bar) in cells co-transfected with N1/K2(R)+N2B/K2(Q)L614A (a), N1/K2(R)L614A+N2B/K2(Q)L614A (b), N1/K2(Q)+N2B/K2(R)L614A (c), or N1/K2(R)L614A+N2B/K2(R)L614A (d). (e) Plot of current evoked immediately after exposure to DHA as a fraction of control current before DHA (mean ± s.e.m.) for the 12 chimaeric constructs and, for comparison, homomeric L614A mutants of GluK2(Q) and (R). Sample size is shown for each bar. Note the logarithmic scale. DHA had minimal effect when L614A and Q to R editing were not present on the same chimaeric subunit; green horizontal bar indicates the 95% confidence interval (C.I.) for N1/K2(Q)L614A +N2B/K2(Q)L614A. Significant potentiation was observed when one of the two subunits included the L614A substitution and Q to R editing (P < 0.0001, one way ANOVA with post hoc Student-Newman-Keuls comparison); 95% C.I. for N1/K2(Q)L614A +N2B/K2(R)L614A (yellow bar) Potentiation was greatest when both chimaeric subunits were edited (R) and mutated (L614A); 95% C.I. for N1/K2(R)L614A+N2B/K2(R)L614A (pink bar).
Figure 5
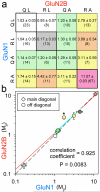
Figure 5. Radial symmetry in chimaeric receptor pores
(a) Interaction matrix for Q/R editing and L614A substitutions to chimaeric N1/K2 and N2B/K2 subunits. Matrix elements display I DHA / I control as mean ± sem (# of cells). Color code: No A + <2R, white; No A + 2R, grey; A not with R, green; 1R with 1 or 2 A, yellow; 1A with 2R, tan; 2A with 2R, pink. (b) Diamonds plot I DHA / I control for the 4 main diagonal elements (Mji versus Mij where i = j) outlined in bold in (a). Circles plot I DHA / I control in N2B/K2 versus N1/K2 for symmetric constructs (off diagonal matrix elements, Mji versus Mij and i ≠ j). Pearson product moment correlation coefficient = 0.925 for the six off diagonal points indicates strong symmetric association (P = 0.0083 that the association is invalid). In addition, linear regression to the 6 off diagonal matrix element points (solid line, 2 parameters) was not statistically superior (F test) to the line of identity through the symmetric main diagonal elements (dashed line, no free parameters). The solid line is shown in cyan over the range of off diagonal points used for regression. It is extended to each axis in red. * Only the N1/K2(Q) +N2B/K2(R)L614A, N1/K2(R)L614A+N2B/K2(Q) coordinate pair displayed significant asymmetry (P = 0.002, one way ANOVA with post hoc Student-Newman-Keuls comparison).
Figure 6
Figure 6. Changes in holding current with DHA and antagonists
(a) Whole-cell current evoked by 10 μM NMDA and 10 μM glycine (open bars) before and after exposure to 15 μM DHA (black bars). The glycine site antagonist ACEA 1021 (1 μM) was applied together with DHA during the periods indicated by the grey bars. After the final exposure to DHA the control external solution contained 0.1% BSA. (b) Plot of current evoked immediately after exposure to DHA (mean ± s.e.m.) as a fraction of control current before DHA for the 12 chimaeric constructs in Fig. 4 versus change in holding current with DHA exposure normalized to the current evoked by NMDA and glycine. Pearson product moment correlation coefficient = 0.949 (P < 0.0001). Sample size as given in Fig. 4e and 5a. (c) Percent block of DHA induced change in holding current (mean ± s.e.m.) for N1/K2(R)L614A + N2B/K2(R)L614A by 1 μM ACEA 1021 or 1 mM 5F-I2CA (20 cells) or by 50 μM APV or 30 μM CPP. Sample size is shown for each bar. (d) Percent change in baseline holding current (mean ± s.e.m.) without DHA exposure.
Figure 7
Figure 7. Decoupling of coagonist sites
(a, b) Whole-cell currents evoked by 1 mM NMDA and 10 μM glycine (solid bars), then by 1 mM, 10, 1 and 0.1 μM NMDA alone (open bars) in the presence of 1 mM 5F-I2CA, a glycine site antagonist (grey bars). N1/K2(Q) + N2B/K2(Q) (a) and N1/K2(R)L614A + N2B/K2(R)L614A (b) before (top) and after (bottom) exposure to 15 μM DHA. (c, d) Currents (mean ± sem) evoked by NMDA alone plus 1 mM 5F-I2CA (circles) normalized to 1 mM NMDA plus 10 μM glycine (diamonds), before (open) and after (filled) exposure to DHA. Smooth curve: best Hill equation fit to NMDA alone (with 5F-I2CA) before and after DHA, EC50 = 1.7 μM, n = 2.1 and Imax = 0.28 (6 cells). (e, f) Current evoked by 100 μM NMDA plus 10 μM glycine (solid bars), then by 50, 10, 2, 0.4, 0.08 and 0.016 μM glycine alone (open bars). Traces from N1/K2(Q) + N2B/K2(Q) before DHA (e) and from N1/K2(R)L614A + N2B/K2(R)L614A after DHA (f). (g, h) Currents (mean ± sem) evoked by glycine alone (circles) normalized to 10 μM NMDA plus 10 μM glycine (diamonds), before (open) and after (filled) exposure to DHA. Smooth curves: best Hill equation fit to glycine alone before and after DHA for N1/K2(Q) + N2B/K2(Q) (g) with EC50 = 0.79 μM, n = 0.82 and Imax = 0.51 (6 cells) and for N1/K2(R)L614A + N2B/K2(R)L614A (h) with EC50 = 0.57 μM, n = 0.87 and Imax = 0.38 (10 cells). Exposure to DHA did not significantly alter the concentration response relations for NMDA alone (c, d) or glycine alone (g, h) (F test).

Similar articles

Cited by

References

    1. Traynelis SF, Wollmuth LP, McBain CJ, Menniti FS, Vance KM, Ogden KK, Hansen KB, Yuan H, Myers SJ, Dingledine R. Glutamate receptor ion channels: structure, regulation, and function. Pharmacol Rev. 2010;62:405–96. - PMC - PubMed
    1. Mayer ML. Emerging models of glutamate receptor ion channel structure and function. Structure. 2011;19:1370–80. - PMC - PubMed
    1. Sobolevsky AI, Rosconi MP, Gouaux E. X-ray structure, symmetry and mechanism of an AMPA-subtype glutamate receptor. Nature. 2009;462:745–756. - PMC - PubMed
    1. Doyle DA, Morais Cabral J, Pfuetzner RA, Kuo A, Gulbis JM, Cohen SL, Chait BT, MacKinnon R. The structure of the potassium channel: molecular basis of K+ conduction and selectivity. Science. 1998;280:69–77. - PubMed
    1. Schorge S, Colquhoun D. Studies of NMDA receptor function and stoichiometry with truncated and tandem subunits. J Neurosci. 2003;23:1151–8. - PMC - PubMed

Publication types

MeSH terms

Substances

LinkOut - more resources