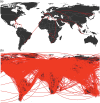
Mapping population and pathogen movements
- PMID: 24480992
- PMCID: PMC3989868
- DOI: 10.1093/inthealth/ihu006
Mapping population and pathogen movements
Abstract
For most of human history, populations have been relatively isolated from each other, and only recently has there been extensive contact between peoples, flora and fauna from both old and new worlds. The reach, volume and speed of modern travel are unprecedented, with human mobility increasing in high income countries by over 1000-fold since 1800. This growth is putting people at risk from the emergence of new strains of familiar diseases, and from completely new diseases, while ever more cases of the movement of both disease vectors and the diseases they carry are being seen. Pathogens and their vectors can now move further, faster and in greater numbers than ever before. Equally however, we now have access to the most detailed and comprehensive datasets on human mobility and pathogen distributions ever assembled, in order to combat these threats. This short review paper provides an overview of these datasets, with a particular focus on low income regions, and covers briefly approaches used to combine them to help us understand and control some of the negative effects of population and pathogen movements.
Keywords: Disease; Migration; Mobility; Modelling; Travel.
Figures


Similar articles
-
Tuberculosis.In: Holmes KK, Bertozzi S, Bloom BR, Jha P, editors. Major Infectious Diseases. 3rd edition. Washington (DC): The International Bank for Reconstruction and Development / The World Bank; 2017 Nov 3. Chapter 11. In: Holmes KK, Bertozzi S, Bloom BR, Jha P, editors. Major Infectious Diseases. 3rd edition. Washington (DC): The International Bank for Reconstruction and Development / The World Bank; 2017 Nov 3. Chapter 11. PMID: 30212088 Free Books & Documents. Review.
-
A realist synthesis of cross-border patient movement from low and middle income countries to similar or higher income countries.Global Health. 2017 Aug 29;13(1):68. doi: 10.1186/s12992-017-0287-8. Global Health. 2017. PMID: 28851382 Free PMC article. Review.
-
Web-based GIS: the vector-borne disease airline importation risk (VBD-AIR) tool.Int J Health Geogr. 2012 Aug 14;11:33. doi: 10.1186/1476-072X-11-33. Int J Health Geogr. 2012. PMID: 22892045 Free PMC article.
-
"Moving like birds": A qualitative study of population mobility and health implications in the Bijagós Islands, Guinea Bissau.Soc Sci Med. 2019 Jun;230:204-213. doi: 10.1016/j.socscimed.2019.03.019. Epub 2019 Mar 14. Soc Sci Med. 2019. PMID: 31030011 Free PMC article.
-
Travel and the emergence of infectious diseases.J Agromedicine. 2004;9(2):161-77. J Agromedicine. 2004. PMID: 19785214
Cited by
-
Analysis of Seasonal Risk for Importation of the Mediterranean Fruit Fly, Ceratitis capitata (Diptera: Tephritidae), via Air Passenger Traffic Arriving in Florida and California.J Econ Entomol. 2016 Dec 1;109(6):2317-2328. doi: 10.1093/jee/tow196. J Econ Entomol. 2016. PMID: 27594703 Free PMC article.
-
Infectious disease in an era of global change.Nat Rev Microbiol. 2022 Apr;20(4):193-205. doi: 10.1038/s41579-021-00639-z. Epub 2021 Oct 13. Nat Rev Microbiol. 2022. PMID: 34646006 Free PMC article. Review.
-
Why are there so few (or so many) circulating coronaviruses?Trends Immunol. 2021 Sep;42(9):751-763. doi: 10.1016/j.it.2021.07.001. Epub 2021 Jul 12. Trends Immunol. 2021. PMID: 34366247 Free PMC article. Review.
-
A Bibliometric Analysis of Corona Pandemic in Social Sciences: A Review of Influential Aspects and Conceptual Structure.IEEE Access. 2020 Jul 13;8:133377-133402. doi: 10.1109/ACCESS.2020.3008733. eCollection 2020. IEEE Access. 2020. PMID: 34812340 Free PMC article.
-
Too afraid to Travel? Development of a Pandemic (COVID-19) Anxiety Travel Scale (PATS).Tour Manag. 2021 Jun;84:104286. doi: 10.1016/j.tourman.2021.104286. Epub 2021 Jan 11. Tour Manag. 2021. PMID: 36530601 Free PMC article.
References
-
- Prothero RM. Disease mobility: a neglected factor in epidemiology. Int J Epidemiol. 1977;6:259–67. - PubMed
-
- Coulibaly S, Deichmann U, Emilia FM, et al. Washington DC: World Bank; 2009. World Development Report 2009: reshaping economic geography.
-
- Prothero RM. London: Longmans, Green & Co. Ltd; 1965. Migrants and Malaria.
Publication types
MeSH terms
Grants and funding
LinkOut - more resources
Full Text Sources
Other Literature Sources
Medical

