. 2014 Apr;25(7):1159-70.
doi: 10.1091/mbc.E13-08-0493. Epub 2014 Jan 29.

Myosin Va mediates Rab8A-regulated GLUT4 vesicle exocytosis in insulin-stimulated muscle cells

Affiliations

Myosin Va mediates Rab8A-regulated GLUT4 vesicle exocytosis in insulin-stimulated muscle cells

Yi Sun et al. Mol Biol Cell. 2014 Apr.

Abstract

Rab-GTPases are important molecular switches regulating intracellular vesicle traffic, and we recently showed that Rab8A and Rab13 are activated by insulin in muscle to mobilize GLUT4-containing vesicles to the muscle cell surface. Here we show that the unconventional motor protein myosin Va (MyoVa) is an effector of Rab8A in this process. In CHO-IR cell lysates, a glutathione S-transferase chimera of the cargo-binding COOH tail (CT) of MyoVa binds Rab8A and the related Rab10, but not Rab13. Binding to Rab8A is stimulated by insulin in a phosphatidylinositol 3-kinase-dependent manner, whereas Rab10 binding is insulin insensitive. MyoVa-CT preferentially binds GTP-locked Rab8A. Full-length green fluorescent protein (GFP)-MyoVa colocalizes with mCherry-Rab8A in perinuclear small puncta, whereas GFP-MyoVa-CT collapses the GTPase into enlarged perinuclear depots. Further, GFP-MyoVa-CT blocks insulin-stimulated translocation of exofacially myc-tagged GLUT4 to the surface of muscle cells. Mutation of amino acids in MyoVa-CT predicted to bind Rab8A abrogates both interaction with Rab8A (not Rab10) and inhibition of insulin-stimulated GLUT4myc translocation. Of importance, small interfering RNA-mediated MyoVa silencing reduces insulin-stimulated GLUT4myc translocation. Rab8A colocalizes with GLUT4 in perinuclear but not submembrane regions visualized by confocal total internal reflection fluorescence microscopy. Hence insulin signaling to the molecular switch Rab8A connects with the motor protein MyoVa to mobilize GLUT4 vesicles toward the muscle cell plasma membrane.


Figures
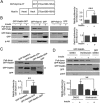
FIGURE 1:
FIGURE 1:
MyoVa-CT binds Rab8A and Rab10 but not Rab13. Binding to Rab8A is insulin, GTP, and PI3K dependent. (A) Schematic representation of MyoVa and the GST fusion protein with the C-terminal amino acids 1260–1854 of MyoVa (GST–MyoVa-CT). (B) Cell lysates prepared from CHO-IR cells expressing GFP-Rab8A, -Rab10, -Rab13, or GFP and treated with/without insulin for 15 min were incubated with glutathione–Sepharose (GSHS) beads loaded with GST–MyoVa-CT. The beads were sedimented, and complexes in the GST–MyoVa-CT pull down or aliquots of lysates (input) were subjected to SDS–PAGE and immunoblotted with anti-GFP antibody, as described in Materials and Methods. The pixel intensity of the pulled-down bands (upper gel) was expressed as the ratio of the pixel intensity of the corresponding band in the input lysates (lower gel) and is presented as the ratio of the insulin to basal samples in the graph bars to the right of the gel (mean ± SE, ***p < 0.001). Phospho-Akt S473 (p-Akt) was measured in lysates to confirm insulin effectiveness. Data are the mean of three independent experiments. (C) Cell lysates prepared from CHO-IR cells expressing GFP-Rab8Awt, the constitutively GTP-bound Rab8AQ67L mutant (GFP–Rab8A-GTP), the constitutively GDP-bound Rab8AT22N mutant (GFP–Rab8A-GDP), or GFP were incubated with GSHS beads loaded with MyoVa-CT. The complexes were pulled down and analyzed as in B. The graph beneath the gels show the quantified results (n = 3, mean ± SE, **p < 0.01). #, Nonspecific band detected by anti-GFP in the input lysates. For the quantification shown in the bar graph, we zoomed in on the image, which allowed us to outline the band separation and select the specific Rab8A band without including the nonspecific one in the input gel. (D) CHO-IR cells were transfected with GFP-Rab8A or GFP for 48 h, followed by pretreatment with 100 nM wortmannin in DMSO (or DMSO alone) for 30 min, followed by treatment with/without insulin (100 nM) for 15 min and with/without wortmannin (or DMSO). Cells were lysed and lysates subjected to GST–MyoVa-CT pull down using GSHS beads, and then complexes or lysate aliquots (input) were separated by SDS–PAGE and immunoblotted with anti-GFP antibody. Lysates were also blotted for p-Akt to confirm insulin and wortmannin effectiveness. The pixel intensity of each binding reaction was quantified as in B and expressed relative to GFP–Rab8Awt-DMSO (mean ± SE, **p < 0.01: insulin vs. insulin + wortmannin). Data are the mean of three independent experiments.
FIGURE 2:
FIGURE 2:
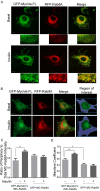
Full-length MyoVa colocalizes with Rab8A in L6 myoblasts, and insulin increases this colocalization in cytoplasmic peripheral regions. L6 cells grown on glass coverslips were cotransfected with GFP–MyoVa-FL and MC-Rab8A for 24 h, followed by no further treatment (basal) or 100 nM insulin for 15 min (insulin), and then processed for spinning-disk fluorescence microscopy. (A) Fluorescence of GFP–MyoVa-FL (green) and MC-Rab8A (red) in representative cells. Excerpts are magnified regions from the original image represented by the outlined region of interest indicated in the merges. Representative images collected from three independent experiments in which >25 cells/experiment were analyzed. (B) Similar experiment as in A but with the area of interest indicated in blue including all regions of the cell except the nuclear and perinuclear regions. (C) Quantification of the ratio of peripheral MC-Rab8A to total MC-Rab8A fluorescence intensity and its response to insulin. (D) Quantification of the Manders coefficient of colocalization of MC-Rab8A relative to GFP–MyoVa-FL.
FIGURE 3:
FIGURE 3:
MyoVa–CT-Rab8A interaction occurs in situ and leads to mislocalization of Rab8A into large puncta and impairs GLUT4 translocation to the cell surface in muscle cells. (A) CHO-IR cells were cotransfected with GFP–MyoVa-CT and mCherry-Rab8A (MC-Rab8A) for 48 h, followed by treatment with the cell-permeant cross-linker DSP (1.5 mM for 30 min) before stimulation with or without insulin (100 nM, 15 min). Cells were lysed in 50 mM Tris, pH 7.4, with 2% SDS. Coimmunoprecipitation (CO-IP) was with mouse anti-mCherry antibody. Immunoprecipitates were immunoblotted with rabbit anti-GFP antibody to detect GFP–MyoVa-CT. Aliquots of lysates were immunoblotted directly for MC-Rab8a (anti-mCherry) or GFP–MyoVa-CT (anti-GFP) (input). (B) CHO-IR cells were cotransfected with GFP–MyoVa-CT and Q67L MC-Rab8A (MC–Rab8A-GTP) or with T22N MC-Rab8A (MC–Rab8A-GDP) for 48 h, followed by treatment with DSP as in A and coimmunoprecipitation with mouse anti-mCherry or mouse immunoglobulin G. (C) L6-GLUT4myc muscle cells were cotransfected overnight with GFP and MC-Rab8A or GFP–MyoVa-CT with MC-Rab8A in 12-well plates. Cells were suspended and plated on glass coverslips for 24 h and then imaged by confocal fluorescence microscopy. Representative collapsed images of two independent experiments with >25 cells quantified/experiment. (D) L6-GLUT4myc muscle cells transfected as described were also stimulated with or without insulin (100 nM, 15 min), processed for measurement of cell surface GLUT4myc, and imaged using a LSM510 Zeiss confocal microscope and quantified as described in Materials and Methods. Bar graph, mean responses from two independent experiments of >25 cells/experiment.
FIGURE 4:
FIGURE 4:
Mutation of putative binding sites for Rab8A on MyoVa-CT abolished the interaction between Rab8A and MyoVa-CT, allowing GLUT4 translocation to proceed. (A) GST–MyoVa-CT or GST–MyoVa-CT(2M) was bound to GSHS beads and incubated with cell lysates from CHO-IR transfected with GFP-Rab8A or GFP, and then the pull-down complexes were subjected to SDS–PAGE. The gel was cut horizontally, and the upper section was stained with Coomassie blue to reveal the amount of GST–MyoVa-CT or GST–MyoVa-CT(2M) on the GSHS beads (input), and the lower section was immunoblotted with anti-GFP antibody (middle and top), as described in Materials and Methods. The binding of GFP-Rab8A to GST–MyoVa-CT (2M) was calculated (as in Figure 1) and is represented as change relative to that of GST–MyoVa-CT with GFP-Rab8A (mean ± SE, ***p < 0.001); data are the summary of three independent experiments. (B) L6-GLUT4myc muscle cells were cotransfected GFP–MyoVa-CT or GFP–MyoVa-CT(2M) with MC-Rab8A, followed by imaging with confocal fluorescence microscopy, presented as collapsed images. MC-Rab8A mislocalized into GFP–MyoVa-CT–positive enlarged puncta; however, GFP–MyoVa-CT(2M) did not colocalize with or induce enlarged MC-Rab8A puncta. Representative images of three independent experiments. (C) L6-GLUT4myc cells were transfected with GFP, GFP–MyoVa-CT, or GFP–MyoVa-CT(2M) in 12-well plates overnight. Cells were split and plated on coverslips the next day, and after 24 h they were treated with or without insulin (100 nM, 15 min) and then processed for measurement of cell-surface GLUT4myc and imaged by confocal microscopy and quantified as described in Materials and Methods. Mean responses from three independent experiments of >25 cells/experiment (mean ± SE, **p < 0.01, insulin GFP vs. insulin GFP–MyoVa-CT; *p < 0.05 insulin GFP–MyoVa-CT vs. insulin GFP–MyoVa-CT(2M).
FIGURE 5:
FIGURE 5:
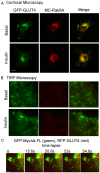
GLUT4 vesicles colocalizes with Rab8A in perinuclear regions but not in the submembrane “TIRF” zone and position along MyoVa structures. L6 muscle cells were cotransfected with GFP-GLUT4 and MC-Rab8A for 48 h, followed by treatment with or without insulin (100 nM, 15 min). (A) The cells were imaged by spinning-disk confocal microscopy as described in Materials and Methods. Representative images of focal planes through the center of the cells from three independent experiments. (B) Paraformaldehyde-fixed myoblasts were imaged with an Olympus 1XR1 TIRF microscope to examine GFP-GLUT4– and MC-Rab8A–positive vesicles beneath the cell surface as described in Materials and Methods. Results are representative of two independent experiments of 15 cells/experiment. (C) Time-lapse images of the position of GLUT4 vesicles along MyoVa structures. L6 muscle cells were cotransfected with GFP–MyoVa-FL and RFP-GLUT4 and then treated with 100 nM insulin for 10 min; live cells were imaged for the subsequent 100 s. Shown are selected time-lapse frames taken at the indicated time points during video recording. Selected time-lapse frames at the indicated time points during the video recording. The arrow points to a representative GLUT4 vesicle on the MyoVa structure.
FIGURE 6:
FIGURE 6:
Knockdown of MyoVa reduces insulin-stimulated GLUT4 translocation to the cell surface of muscle cells. L6-GLUT4myc cells were transfected with siRNA to rat MyoVa (si-MyoVa) or scrambled nonrelated siRNA (si-NR) (300 nM for 72 h), followed by treatment with or without insulin (100 nM, 15 min). (A) Cell lysates were immunoblotted for MyoVa, β-actin, and phospho-Akt S473. The intensities of MyoVa and β-actin were quantified and expressed as ratio of MyoVa/β-actin in si-MyoVa–treated cells relative to that of si-NR (mean ± SE, ***p < 0.001). (B) Si-MyoVa– or si-NR–transfected L6-GLUT4myc cells were processed for cell-surface GLUT4myc levels using a colorimetric assay as described in Materials and Methods. Fold changes relative to si-NR. Mean responses from three independent experiments (mean ± SE, **p < 0.01).
FIGURE 7:
FIGURE 7:
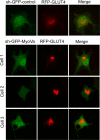
Silencing the expression of MyoVa causes GLUT4 collapse in the perinuclear region. L6 muscle cells were cotransfected with sh-GFP-MyoVa or sh-GFP control vector, along with RFP-GLUT4 for 48 h, and then processed for confocal spinning-disk fluorescence microscopy. Representative images from a sh-GFP control–transfected cell or three separate sh-GFP-MyoVa–transfected cells and their relative RFP-GLUT4 distribution. Results are representative from three independent experiments.
FIGURE 8:
FIGURE 8:
Silencing the expression of MyoVa or expression of MyoVa-CT does not alter the localization of the transferrin receptor, furin, or syntaxin-6. L6-GLUT4myc cells were transfected with sh-GFP-MyoVa, GFP–MyoVa-CT, or sh-GFP control vector for 45 h, followed by fixation with 3% PFA. Transferrin receptor, furin, or syntaxin-6 (STX6) were then detected with cognate antibodies coupled with appropriate Alexa 555 (red)–conjugated secondary antibodies. Results are representative from three independent experiments.

Similar articles

Cited by

References

    1. Boguslavsky S, Chiu T, Foley KP, Osorio-Fuentealba C, Antonescu CN, Bayer KU, Bilan PJ, Klip A. Myo1c binding to submembrane actin mediates insulin-induced tethering of GLUT4 vesicles. Mol Biol Cell. 2012;23:4065–4078. - PMC - PubMed
    1. Brewer PD, Romenskaia I, Kanow MA, Mastick CC. Loss of AS160 Akt substrate causes Glut4 protein to accumulate in compartments that are primed for fusion in basal adipocytes. J Biol Chem. 2011;286:26287–26297. - PMC - PubMed
    1. Bryant DM, Datta A, Rodriguez-Fraticelli AE, Peranen J, Martin-Belmonte F, Mostov KE. A molecular network for de novo generation of the apical surface and lumen. Nat Cell Biol. 2010;12:1035–1045. - PMC - PubMed
    1. Cao TT, Chang W, Masters SE, Mooseker MS. Myosin-Va binds to and mechanochemically couples microtubules to actin filaments. Mol Biol Cell. 2004;15:151–161. - PMC - PubMed
    1. Chen Y, Deng Y, Zhang J, Yang L, Xie X, Xu T. GDI-1 preferably interacts with Rab10 in insulin-stimulated GLUT4 translocation. Biochem J. 2009;422:229–235. - PMC - PubMed

Publication types

MeSH terms