

Conditional knockout of the RNA-binding protein HuR in CD4⁺ T cells reveals a gene dosage effect on cytokine production
- PMID: 24477678
- PMCID: PMC3960399
- DOI: 10.2119/molmed.2013.00127
Conditional knockout of the RNA-binding protein HuR in CD4⁺ T cells reveals a gene dosage effect on cytokine production
Abstract
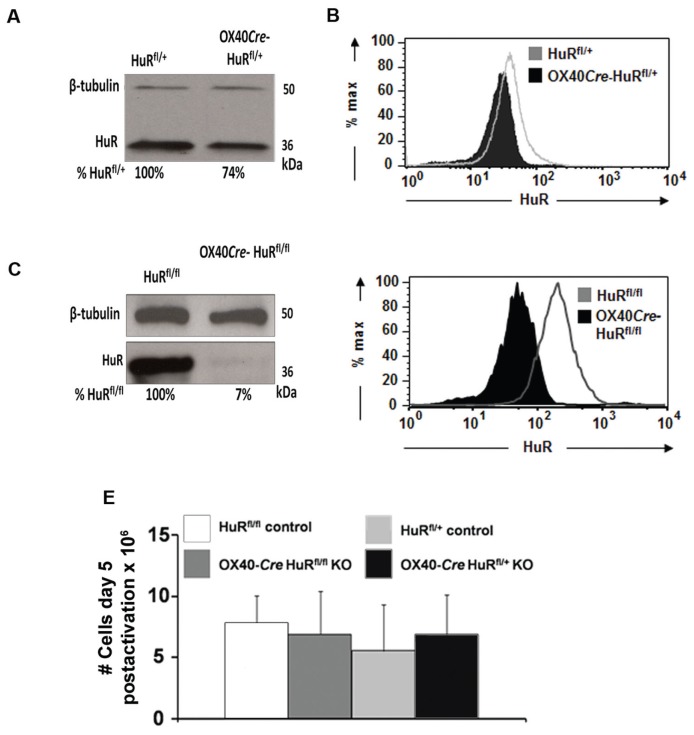
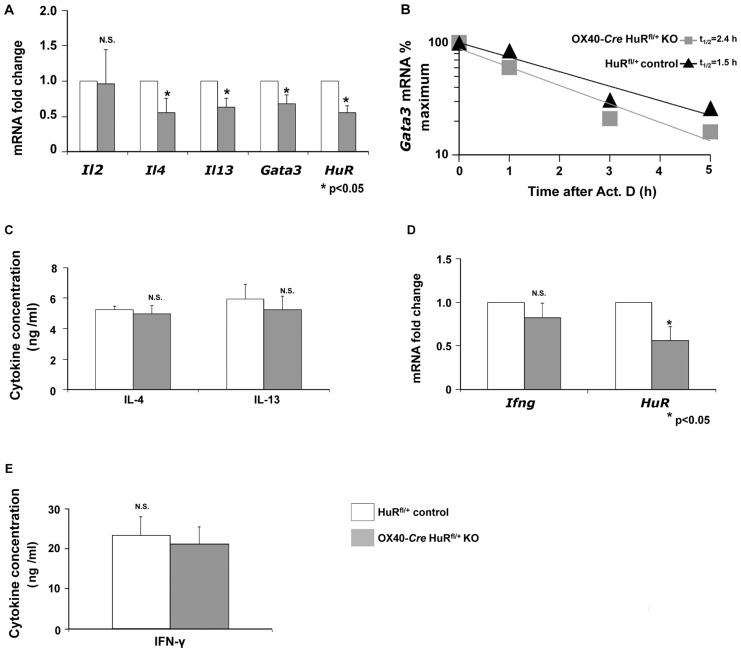
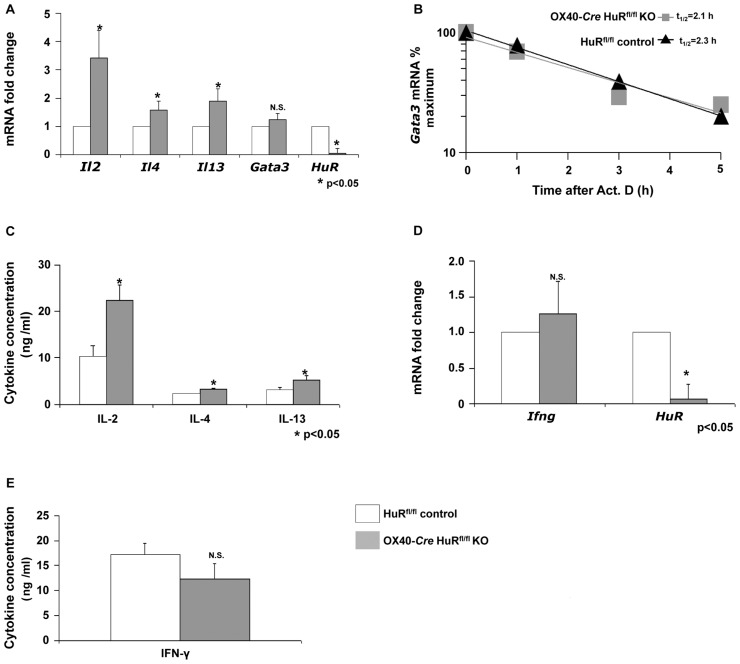
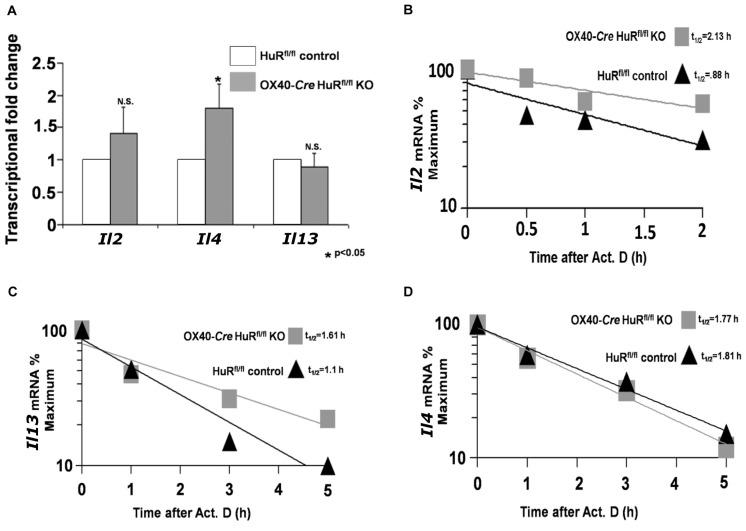
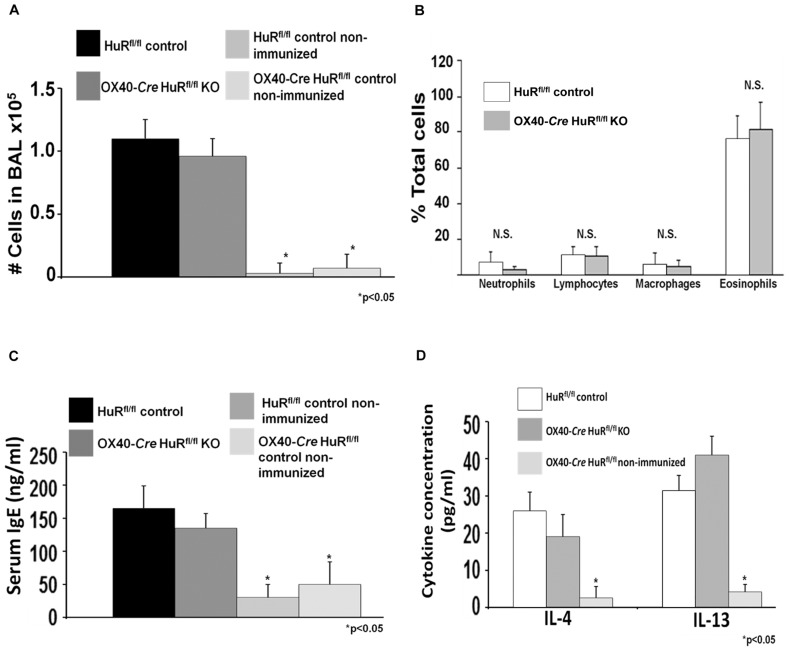
The posttranscriptional mechanisms by which RNA binding proteins (RBPs) regulate T-cell differentiation and cytokine production in vivo remain unclear. The RBP HuR binds to labile mRNAs, usually leading to increases in mRNA stability and/or translation. Previous work demonstrated that HuR binds to the mRNAs encoding the Th2 transcription factor trans-acting T-cell-specific transcription factor (GATA-3) and Th2 cytokines interleukin (IL)-4 and IL-13, thereby regulating their expression. By using a novel conditional HuR knockout (KO) mouse in which HuR is deleted in activated T cells, we show that Th2-polarized cells from heterozygous HuR conditional (OX40-Cre HuR(fl/+)) KO mice had decreased steady-state levels of Gata3, Il4 and Il13 mRNAs with little changes at the protein level. Surprisingly, Th2-polarized cells from homozygous HuR conditional (OX40-Cre HuR(fl/fl)) KO mice showed increased Il2, Il4 and Il13 mRNA and protein via different mechanisms. Specifically, Il4 was transcriptionally upregulated in HuR KO T cells, whereas Il2 and Il13 mRNA stabilities increased. Additionally, when using the standard ovalbumin model of allergic airway inflammation, HuR conditional KO mice mounted a robust inflammatory response similar to mice with wild-type HuR levels. These results reveal a complex differential posttranscriptional regulation of cytokines by HuR in which gene dosage plays an important role. These findings may have significant implications in allergies and asthma, as well as autoimmune diseases and infection.
Figures


Similar articles
-
Transcriptomic-Wide Discovery of Direct and Indirect HuR RNA Targets in Activated CD4+ T Cells.PLoS One. 2015 Jul 10;10(7):e0129321. doi: 10.1371/journal.pone.0129321. eCollection 2015. PLoS One. 2015. PMID: 26162078 Free PMC article.
-
Coordinate regulation of GATA-3 and Th2 cytokine gene expression by the RNA-binding protein HuR.J Immunol. 2011 Jul 1;187(1):441-9. doi: 10.4049/jimmunol.1001881. Epub 2011 May 25. J Immunol. 2011. PMID: 21613615 Free PMC article.
-
Posttranscriptional gene regulation of IL-17 by the RNA-binding protein HuR is required for initiation of experimental autoimmune encephalomyelitis.J Immunol. 2013 Dec 1;191(11):5441-50. doi: 10.4049/jimmunol.1301188. Epub 2013 Oct 28. J Immunol. 2013. PMID: 24166976 Free PMC article.
-
Functional interplay between RNA-binding protein HuR and microRNAs.Curr Protein Pept Sci. 2012 Jun;13(4):372-9. doi: 10.2174/138920312801619394. Curr Protein Pept Sci. 2012. PMID: 22708488 Free PMC article. Review.
-
GATA-3 promotes Th2 responses through three different mechanisms: induction of Th2 cytokine production, selective growth of Th2 cells and inhibition of Th1 cell-specific factors.Cell Res. 2006 Jan;16(1):3-10. doi: 10.1038/sj.cr.7310002. Cell Res. 2006. PMID: 16467870 Review.
Cited by
-
RNA Metabolism in T Lymphocytes.Immune Netw. 2022 Oct 7;22(5):e39. doi: 10.4110/in.2022.22.e39. eCollection 2022 Oct. Immune Netw. 2022. PMID: 36381959 Free PMC article. Review.
-
HuR controls apoptosis and activation response without effects on cytokine 3' UTRs.RNA Biol. 2019 May;16(5):686-695. doi: 10.1080/15476286.2019.1582954. Epub 2019 Mar 4. RNA Biol. 2019. PMID: 30777501 Free PMC article.
-
Post-transcriptional control of T-cell cytokine production: Implications for cancer therapy.Immunology. 2021 Sep;164(1):57-72. doi: 10.1111/imm.13339. Epub 2021 May 10. Immunology. 2021. PMID: 33884612 Free PMC article. Review.
-
Transcriptomic-Wide Discovery of Direct and Indirect HuR RNA Targets in Activated CD4+ T Cells.PLoS One. 2015 Jul 10;10(7):e0129321. doi: 10.1371/journal.pone.0129321. eCollection 2015. PLoS One. 2015. PMID: 26162078 Free PMC article.
-
Posttranscriptional regulation of T helper cell fate decisions.J Cell Biol. 2018 Aug 6;217(8):2615-2631. doi: 10.1083/jcb.201708075. Epub 2018 Apr 23. J Cell Biol. 2018. PMID: 29685903 Free PMC article. Review.
References
-
- Cheadle C, et al. Stability regulation of mRNA and the control of gene expression. Ann N Y Acad Sci. 2005;1058:196–204. - PubMed
Publication types
MeSH terms
Substances
Grants and funding
LinkOut - more resources
Full Text Sources
Other Literature Sources
Molecular Biology Databases
Research Materials
Miscellaneous
