Comparative Study
. 2014 Jan 27;9(1):e87377.
doi: 10.1371/journal.pone.0087377. eCollection 2014.

Activation of ERα signaling differentially modulates IFN-γ induced HLA-class II expression in breast cancer cells

Affiliations
Comparative Study

Activation of ERα signaling differentially modulates IFN-γ induced HLA-class II expression in breast cancer cells

Ahmed A Mostafa et al. PLoS One. .

Abstract

The coordinate regulation of HLA class II (HLA-II) is controlled by the class II transactivator, CIITA, and is crucial for the development of anti-tumor immunity. HLA-II in breast carcinoma is associated with increased IFN-γ levels, reduced expression of the estrogen receptor (ER) and reduced age at diagnosis. Here, we tested the hypothesis that estradiol (E₂) and ERα signaling contribute to the regulation of IFN-γ inducible HLA-II in breast cancer cells. Using a panel of established ER⁻ and ER⁺ breast cancer cell lines, we showed that E₂ attenuated HLA-DR in two ER⁺ lines (MCF-7 and BT-474), but not in T47D, while it augmented expression in ER⁻ lines, SK-BR-3 and MDA-MB-231. To further study the mechanism(s), we used paired transfectants: ERα⁺ MC2 (MDA-MB-231 c10A transfected with the wild type ERα gene) and ERα⁻ VC5 (MDA-MB-231 c10A transfected with the empty vector), treated or not with E₂ and IFN-γ. HLA-II and CIITA were severely reduced in MC2 compared to VC5 and were further exacerbated by E₂ treatment. Reduced expression occurred at the level of the IFN-γ inducible CIITA promoter IV. The anti-estrogen ICI 182,780 and gene silencing with ESR1 siRNA reversed the E2 inhibitory effects, signifying an antagonistic role for activated ERα on CIITA pIV activity. Moreover, STAT1 signaling, necessary for CIITA pIV activation, and selected STAT1 regulated genes were variably downregulated by E₂ in transfected and endogenous ERα positive breast cancer cells, whereas STAT1 signaling was noticeably augmented in ERα⁻ breast cancer cells. Collectively, these results imply immune escape mechanisms in ERα⁺ breast cancer may be facilitated through an ERα suppressive mechanism on IFN-γ signaling.


Conflict of interest statement

Competing Interests: The authors have declared that no competing interests exist.

Figures

Figure 1
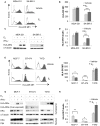
Figure 1. E2 differentially modulates inducible HLA-DR expression in ERα+ and ERα breast cancer cell lines.
MDA-MB-231, SK-BR-3, MCF-7, BT-474, and T47D were cultured in E2-depleted media, treated with vehicle (ethanol) or E2 (10−9 M) and stimulated or not with IFN-γ (100 U/ml) for 96 hours. (A & E) HLA-DR cell surface expression (L243) was analyzed by flow cytometry: grey line, isotype control; black line, constitutive expression; shaded histogram, IFN-γ induced expression. (B & F) Bar graphs represent the MFI (mean florescence intensity) ± SEM for HLA-DR expression of three independent experiments. (C & G) Western blot analysis was performed on cytoplasmic and nuclear extracts for ERα expression (HC-20) and on cytoplasmic extracts for HLA-DRα (TAL 1B5). Protein loading controls included α-tubulin (B-7) and P84 (5E10) for cytoplasmic and nuclear proteins, respectively. (D & H) Bar graphs show the ratio of band intensity for HLA-DRα, normalized to the α-tubulin band intensity and represent the mean ± SEM of three independent experiments (*p<0.05, **p<0.01, ***p<0.001).
Figure 2
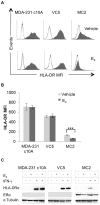
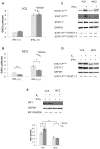
Figure 2. IFN-γ inducible HLA-DR is down regulated in the ERα+ transfected breast cancer cell line, MC2.
MDA-MB-231 clone 10A (MDA-231 c10A), VC5 (MDA-231 c10A, transfected with the empty plasmid vector) and MC2 (MDA-231 c10A, transfected with wild type ESR1) were cultured in E2-depleted medium and stimulated or not with IFN-γ (100 U/ml) for 96 hours. (A) HLA-DR cell surface expression (L243) was analyzed by flow cytometry: grey line, isotype control; black line, constitutive expression; shaded histogram, IFN-γ induced expression. (B) Bar graphs represent the MFI ± SEM for HLA-DR expression of three independent experiments (***p<0.001). (C) Western blot analysis was performed on whole cell lysates for HLA-DRα (TAL 1B5) and ERα (HC-20).
Figure 3
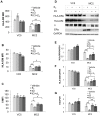
Figure 3. Coordinate downregulation of IFN-γ inducible HLA-II expression by E2 is reversed by ICI-mediated degradation of ERα in MC2 cells.
VC5 and MC2 cells were cultured in E2-depleted media, treated with vehicle (ethanol), E2 (10−9 M) or/and ICI (10−6 M) followed by stimulation with IFN-γ (100 U/ml) for 96 hours. HLA-II expression was analyzed by surface flow cytometry using (A) anti-DR, (L243), and intracellular flow cytometry using (B) anti-DM (Map.DM1) and (C) anti-Ii (LN2). Bar graphs represent the MFI ± SEM of three independent experiments. (*p<0.05, **p<0.01). (D) Western blot analysis was performed on whole cell extracts using for HLA-DRα (TAL 1B5), HLA-DM (TAL18.1) and Ii (LN2); GAPDH (Ab8245) is the protein loading control. Bar graphs show the ratio of band intensities, normalized to GAPDH band intensities and represent the mean ± SEM ratio of three independent experiments: (E) HLA-DRα/GAPDH (F) HLA-DM/GAPDH, and (G) Ii/GAPDH (* p<0.05, ** p<0.01).
Figure 4
Figure 4. E2-ERα signaling down regulates CIITA protein and mRNA expression in ER+ BCCL.
VC5 and MC2 cells were cultured in E2-depleted media, treated with vehicle (ethanol), E2 (10−9 M) or/and ICI (10−6 M) and stimulated or not with IFN-γ (100 U/ml) for 24 and 4 hours, for CIITA protein and mRNA expression, respectively. (A) Western blot analysis was performed on cytoplasmic and nuclear extracts for CIITA (antiserum #21) and ERα (HC-20). (B) Cytoplasmic CIITA and nuclear CIITA were normalized to GAPDH and P84 respectively; bar graphs represent the mean ± SEM ratio of three independent experiments (**p<0.01). (C) CIITA mRNA was relatively quantified by real time PCR using Taqman gene expression assay. GAPDH was used as an endogenous control and the data were expressed relative to a control B cell line (RAJI). Bar graphs represent the mean ± SEM of three replicate assays (**p<0.01).
Figure 5
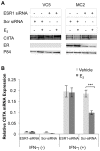
Figure 5. Silencing ERα with ESR1 siRNA reversed the inhibitory effect of E2 on CIITA expression.
(A) ERα was silenced (ESR1 siRNA) or not (scrambled siRNA) in MC2; VC5 served as an ERα negative cell control. Cells were treated with vehicle (ethanol) or E2 (10−9 M) and stimulated or not with IFN-γ (100 U/ml) for 24 hours. Nuclear lysates were prepared and probed for CIITA (anti-serum #21), ERα (HC-20), and p84. Each figure represents one of three individual experiments. (B) ESR1 siRNA and scrambled siRNA transfected MC2 cells were treated with either vehicle (ethanol) or E2 (10−9 M) followed by stimulation with or without IFN-γ (100 U/ml) for 4 hours and CIITA mRNA was relatively quantified by real time PCR using Taqman gene expression assay. GAPDH was used as an endogenous control and the data were expressed relative to a control B cell line (RAJI). Bar graphs represent the mean ± SEM of three replicate assays (*** p<0.001).
Figure 6
Figure 6. E2-ERα signaling pathway interferes with CIITA pIV activity in MC2.
VC5 and MC2 cells were cultured in E2-depleted media followed by transfection with CIITA pIV luciferase constructs. On the following day, cells were treated with vehicle (ethanol), E2 (10−9 M) and/or ICI (10−6 M), and stimulated or not with IFN-γ (100 U/ml) for 12 hours. Data are expressed as fold induction over the PGL2 Basic empty plasmid after controlling for transfection efficiency using cells dual transfected with GFP (Green Florescent Protein). The effect of ERα on the transcription activation of CIITA PIV was determined from relative luciferase activities in transfected MC2. Error bars represent the mean ± SEM of three independent experiments (**p<0.01).
Figure 7
Figure 7. Mutation of putative ERE sites in CIITA pIV does not enhance CIITA pIV activation in MC2.
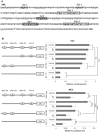
(A) CIITA pIV nucleotide sequence from −346 to +50 with the GAS and IRF1 binding sites (shaded hexagon) and the predicted ERE (clear rectangles) were identified using online transcription factor prediction software, (http://tfbind.hgc.jp/, http://alggen.lsi.upc.es/ and http://www.cbrc.jp/index.eng.html). Site directed mutagenesis was used to perform deletion of the predicted ERE. (B) VC5 and MC2 were transfected with CIITA pIV constructs, then treated with vehicle (ethanol) or E2 (10−9 M) and stimulated with IFN-γ (100 U/ml) for 12 hours, followed by determination of luciferase activity. Bar graphs represent the mean ± SEM of three independent experiments (**p<0.01, ***p<0.001).
Figure 8
Figure 8. GAS promoter activity, STAT1 activation and IRF1 expression were reduced in MC2 as compared to VC5.
(A) VC5 and (B) MC2 were cultured in E2-depleted media and transfected with 8 X GAS binding sequence construct, then treated with vehicle (ethanol), E2 (10−9 M) and stimulated or not with IFN-γ (100 U/ml) for 6 hours. Firefly luciferase activities in samples were normalized to Renilla luciferase activities in the same samples and expressed as fold induction over the un-stimulated mock. Error bars represent the mean ± SEM of three independent experiments (*p<0.05, ** p<0.01). (C) VC5 and MC2 were stimulated with IFN-γ (100 U/ml) for 15 minutes, STAT1 activation was detected using STAT1 Phospho-Tyrosine701 and Phospho-Serine 727 antibodies. (D) VC5 and MC2 were treated or not with E2 (10−9 M) for 4 hours, followed by stimulation with IFN-γ (100 U/ml) for 15 minutes, STAT1 activation was detected using STAT1 Phospho-Tyrosine701. (E) Western blot analysis of whole cell lysates, prepared from VC5 and MC2 stimulated with IFN-γ (100 U/ml) for 96 hours, for IRF1 (BD-20) expression. Error bars represent the mean ± SEM of three independent experiments (*p<0.05, *** p<0.001).
Figure 9
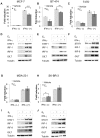
Figure 9. E2 differentially down regulates IFN-γ signaling and IFN-γ induced proteins in endogenous ER+ breast cancer cell lines.
(A) MCF-7, (B) BT-474, (C) T47D, (G) MDA-MD-231, and (H) SK-BR-3 were cultured in E2-depleted media, transfected with 8 X GAS binding sequence construct, then treated with vehicle (ethanol), E2 (10−9 M) and stimulated or not with IFN-γ (100 U/ml) for 6 hours. Firefly luciferase activities in samples were normalized to Renilla luciferase activities in the same samples and expressed as fold induction over the un-stimulated mock. (D) MCF-7, (E) BT-474, (F) T47D, (I) MDA-MB-231 and (J) SK-BR-3 were cultured in E2-depleted media, treated with vehicle (ethanol), or E2 (10−9 M) and stimulated or not with IFN-γ (100 U/ml) for 96 hours. Western blot analysis of cytoplasmic extracts was performed for expression of IFN-γ inducible proteins: STAT1 (06-501), IRF1 (BD-20), IRF9 (C-20), GILT (T-18). Each figure represents one of three independent experiments.

Similar articles

Cited by

References

    1. Armstrong TD, Clements VK, Ostrand-Rosenberg S (1998) MHC class II-transfected tumor cells directly present antigen to tumor-specific CD4+ T lymphocytes. J Immunol 160: 661–666. - PubMed
    1. Meazza R, Comes A, Orengo AM, Ferrini S, Accolla RS (2003) Tumor rejection by gene transfer of the MHC class II transactivator in murine mammary adenocarcinoma cells. Eur J Immunol 33: 1183–1192. - PubMed
    1. Accolla RS, Frangione V, De Lerma Barbaro A, Mortara L (2010) New strategies of mammary cancer vaccination. Breast Journal 16: S42–S44. - PubMed
    1. Accolla RS, Tosi G (2012) Optimal MHC-II-restricted tumor antigen presentation to CD4+ T helper cells: The key issue for development of anti-tumor vaccines. J Transl Med 10: 154. - PMC - PubMed
    1. Collins T, Korman AJ, Wake CT, Boss JM, Kappes DJ, et al. (1984) Immune interferon activates multiple class II major histocompatibility complex genes and the associated invariant chain gene in human endothelial cells and dermal fibroblasts. Proc Natl Acad Sci U S A 81: 4917–4921. - PMC - PubMed

Publication types

MeSH terms