. 2014 Jan 22;34(4):1462-74.
doi: 10.1523/JNEUROSCI.2388-13.2014.

Cav2.1 channels control multivesicular release by relying on their distance from exocytotic Ca2+ sensors at rat cerebellar granule cells

Affiliations

Cav2.1 channels control multivesicular release by relying on their distance from exocytotic Ca2+ sensors at rat cerebellar granule cells

Shin'Ichiro Satake et al. J Neurosci. .

Abstract

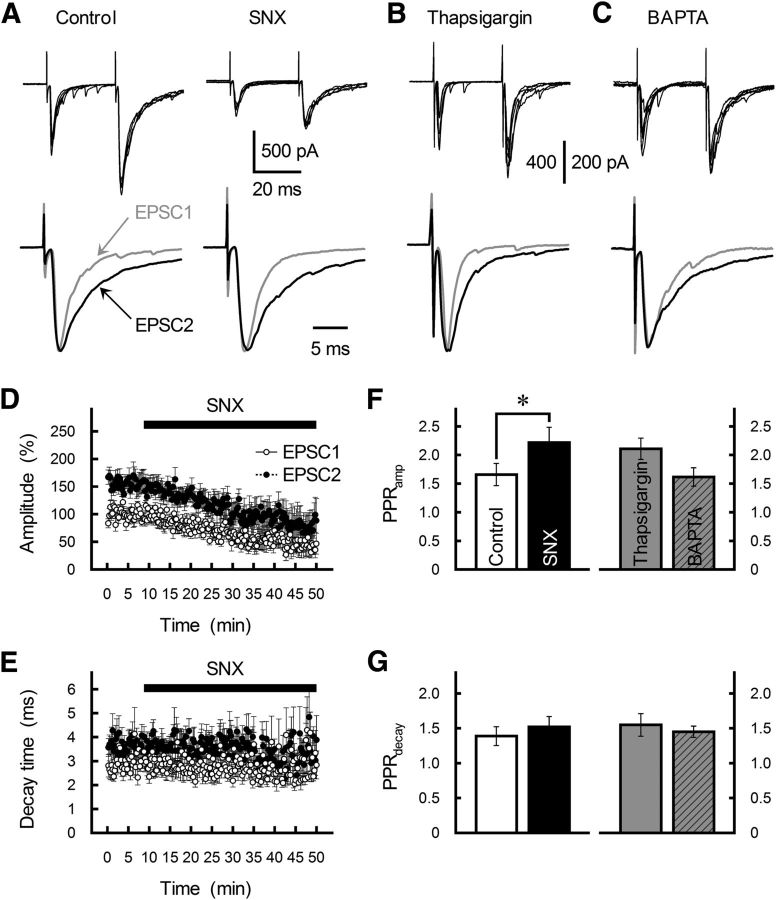
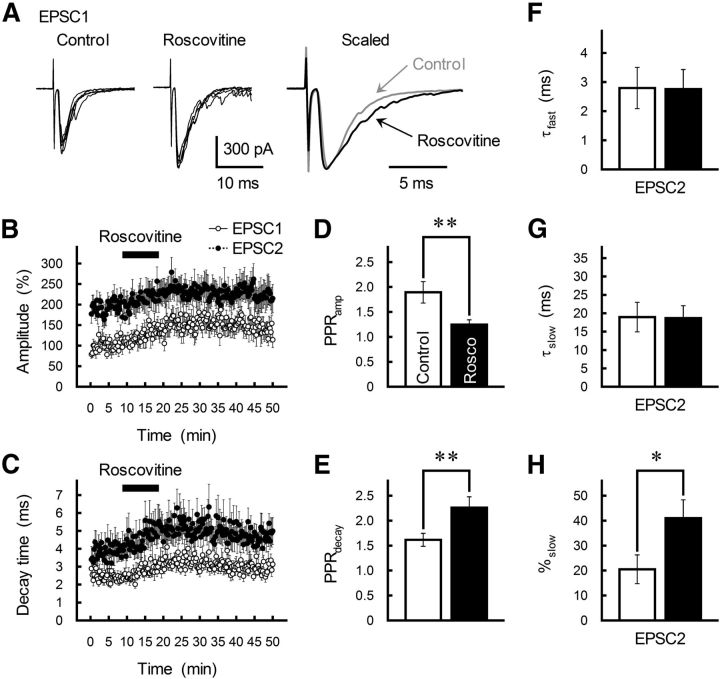
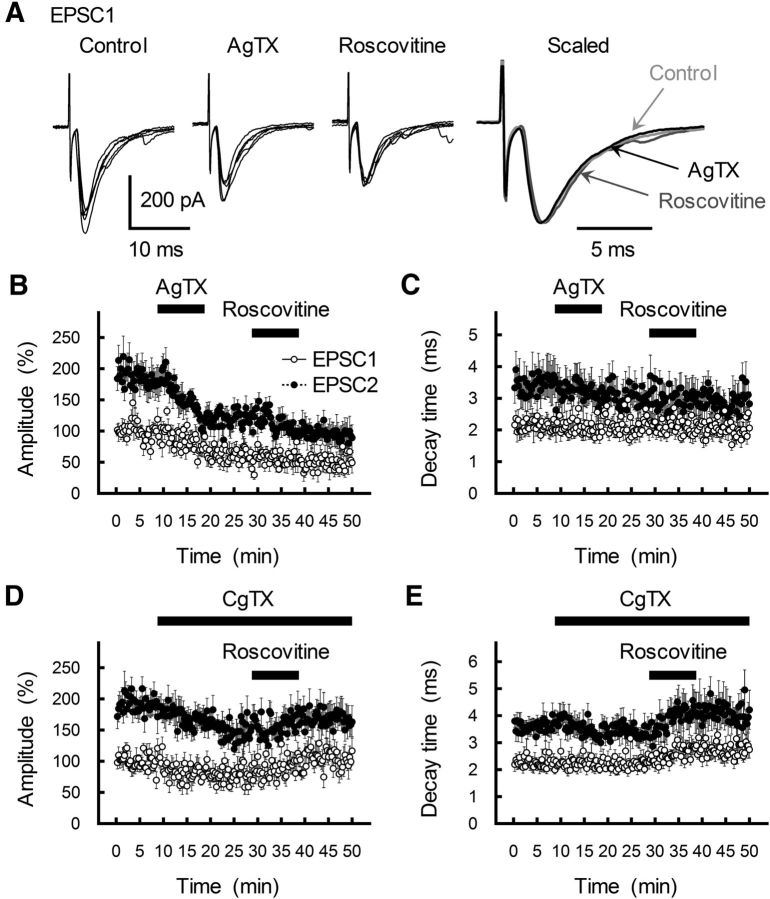
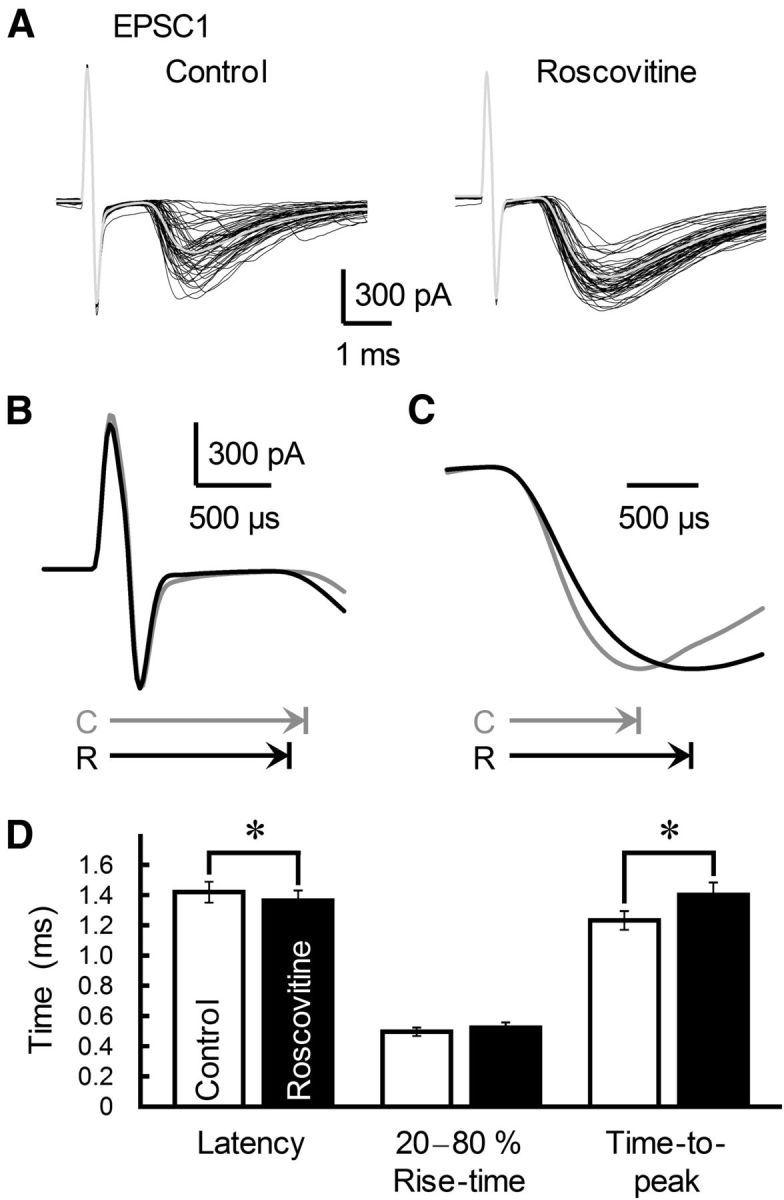
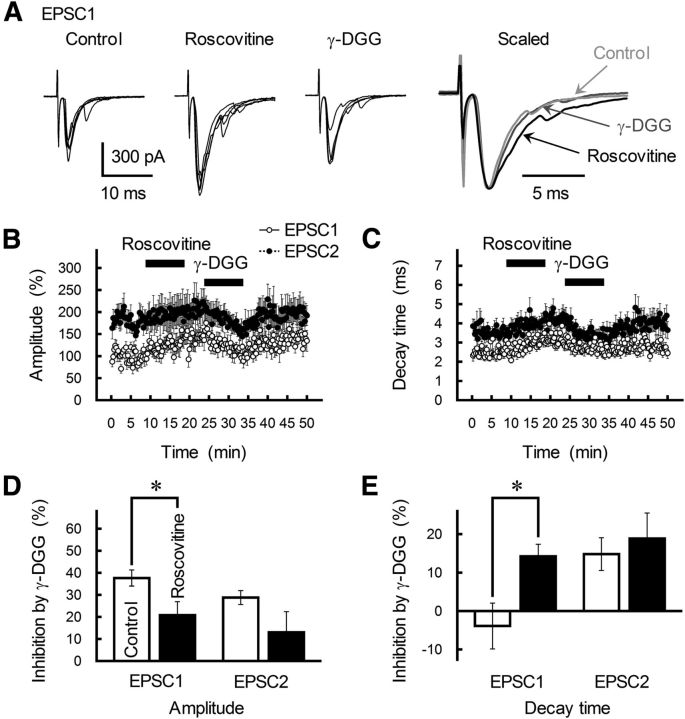
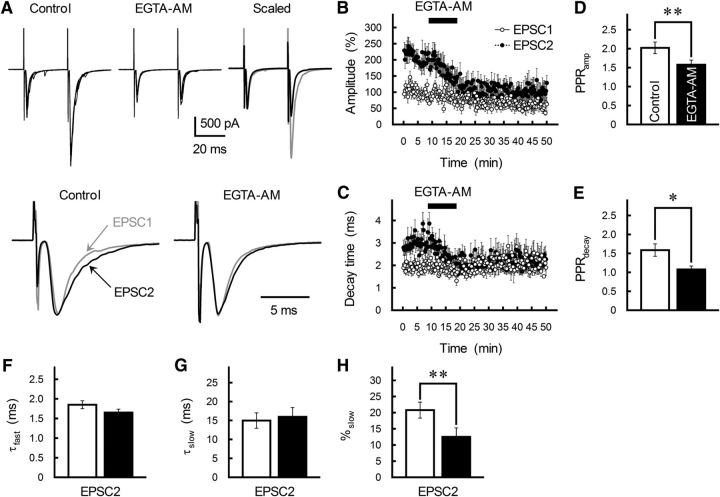
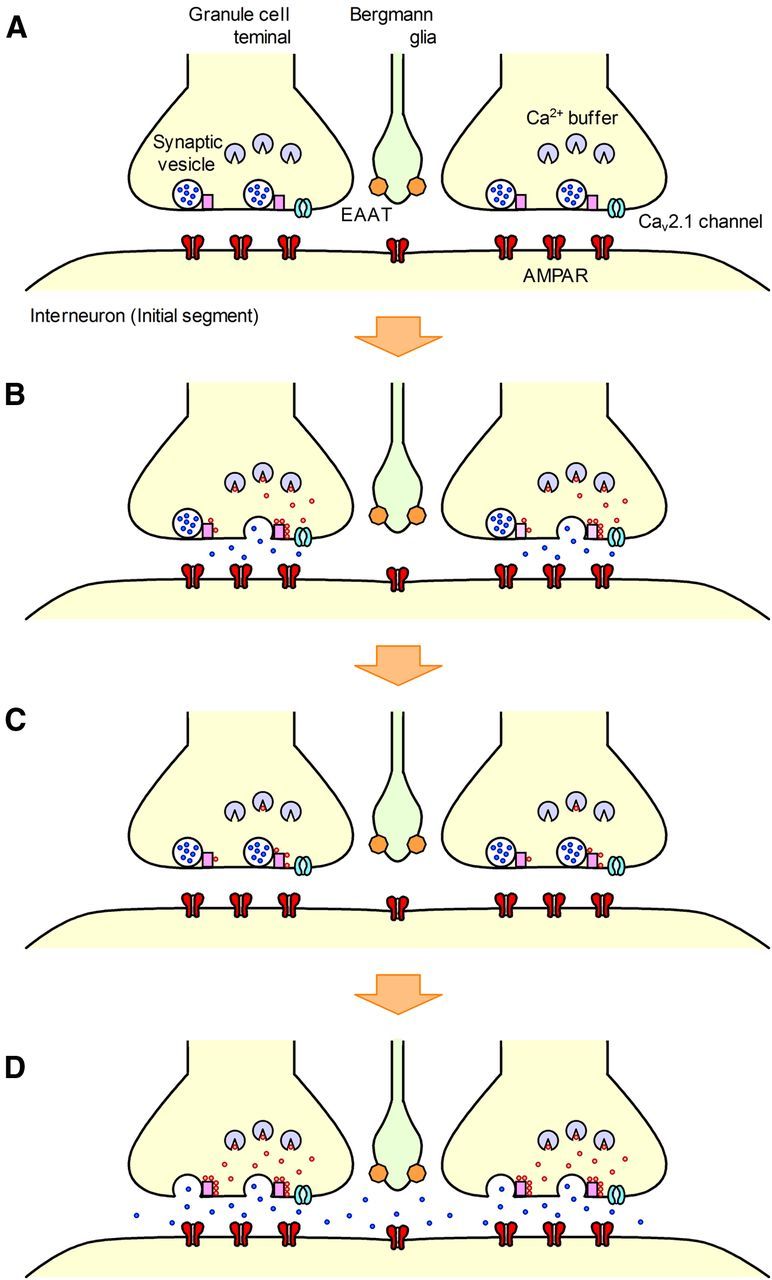
The concomitant release of multiple numbers of synaptic vesicles [multivesicular release (MVR)] in response to a single presynaptic action potential enhances the flexibility of synaptic transmission. However, the molecular mechanisms underlying MVR at a single CNS synapse remain unclear. Here, we show that the Cav2.1 subtype (P/Q-type) of the voltage-gated calcium channel is specifically responsible for the induction of MVR. In the rat cerebellar cortex, paired-pulse activation of granule cell (GC) ascending fibers leads not only to a facilitation of the peak amplitude (PPFamp) but also to a prolongation of the decay time (PPPdecay) of the EPSCs recorded from molecular layer interneurons. PPFamp is elicited by a transient increase in the number of released vesicles. PPPdecay is highly dependent on MVR and is caused by dual mechanisms: (1) a delayed release and (2) an extrasynaptic spillover of the GC transmitter glutamate and subsequent pooling of the glutamate among active synapses. PPPdecay was specifically suppressed by the Cav2.1 channel blocker ω-agatoxin IVA, while PPFamp responded to Cav2.2/Cav2.3 (N-type/R-type) channel blockers. The membrane-permeable slow Ca(2+) chelator EGTA-AM profoundly reduced the decay time constant (τdecay) of the second EPSC; however, it only had a negligible impact on that of the first, thereby eliminating PPPdecay. These results suggest that the distance between presynaptic Cav2.1 channels and exocytotic Ca(2+) sensors is a key determinant of MVR. By transducing presynaptic action potential firings into unique Ca(2+) signals and vesicle release profiles, Cav2.1 channels contribute to the encoding and processing of neural information.

Keywords: Ca2+ microdomain; roscovitine; whole-cell patch clamp.


Figures

Figure 1.
Figure 1.
Presynaptic Cav2.1 (P/Q-type) and Cav2.2 (N-type) channels regulate different forms of short-term plasticity at GC-MLI synapses. A, B, Effects of the Cav2.1 channel-selective blocker AgTX (0.1 μm; A) and the Cav2.2 channel-selective blocker CgTX (1 μm; B) on GC-MLI synaptic transmission. Top, GC axons were stimulated with paired pulses (ISI of 30 ms). Five EPSC pairs recorded from a single MLI before (left) and after (right) treatment with the indicated blocker are superimposed. Bottom, Averaged traces of EPSC1 (gray traces) and EPSC2 (black traces) are scaled to the same peak amplitude. C, D, Time course of changes in the amplitude of the EPSC1 (white circles) and EPSC2 (closed circles) after the application of AgTX (0.1 μm; C) or CgTX (1 μm; D). EPSCs were evoked every 15 s by test stimulation. The amplitude is expressed as a percentage of EPSC1 amplitude determined before drug application. AgTX or CgTX was applied for 10 min by perfusion (as indicated by a horizontal bar). Each point represents the mean ± SEM of 10 cells. E, H, Summary of PPRamp (E) and PPRdecay (H) examined with an ISI of 30 ms before (control, white columns) and after treatment with AgTX (0.1 μm, black columns) or CgTX (1 μm, gray columns). Each column represents the mean ± SEM (n = 8–20 cells). **p < 0.01. F, G, Time course of changes in the τdecay of EPSC1 (white circles) and EPSC2 (black circles) after the application of AgTX (0.1 μm; F) or CgTX (1 μm; G). Each point represents the mean ± SEM (n = 8–11). IK, Summary of the effects of AgTX (black columns) or CgTX (gray columns) on EPSC2 decay kinetics as fitted by a double-exponential function. Each column represents the mean ± SEM (n = 8–18). *p < 0.05.
Figure 2.
Figure 2.
Effects of subtype-selective Cav2 channel blockers on the rising phase of GC-MLI EPSC. A, E, Thirty consecutive EPSC2 sweeps acquired before (control) and after a 10 min application of AgTX (0.1 μm; A) or CgTX (0.1 μm; E). The superimposed averaged EPSC is indicated by a gray line. B, C, Superimposed average traces of the early period from stimulation to EPSC onset (B) and the period from onset to peak (C) of EPSC2 before (control, gray trace) and after (black trace) treatment with AgTX. Horizontal arrows indicate the latency from the stimulus artifact to EPSC onset (B) and from EPSC onset to peak (C). F, G, Averaged traces as those in B and C but in the presence of CgTX. Traces were aligned at the center of stimulation artifact (B, F) or scaled to the same peak amplitude (C, G). D, H, Summary of EPSC2 kinetics (#2, ISI of 30 ms) before (black columns) and after (gray columns) AgTX (n = 11; D) or CgTX (n = 8; H) treatment. For comparison, latency and time-to-peak values of EPSC1 are also shown (#1, white columns). Each column represents the mean ± SEM. *p < 0.05.
Figure 3.
Figure 3.
Effects of the Cav2.3 channel blocker SNX-482, the intracellular Ca2+ secretagogue thapsigargin, and the Ca2+ chelator BAPTA on PPFamp and PPPdecay at GC-MLI synapses. AC, Effects of extracellular SNX-482 (0.1 μm; A), extracellular thapsigargin (1 μm; B), and postsynaptic BAPTA injection (20 mm; C) on GC-MLI EPSC. Paired EPSCs were evoked at an ISI of 30 ms. Top, Five successive EPSC pairs recorded from a single MLI are shown. Bottom, Averaged traces of EPSC1 (gray traces) and EPSC2 (black traces) are scaled to the same peak amplitude. D, E, Time course of changes in the amplitude (D) and τdecay (E) of EPSC1 (white circles) and EPSC2 (black circles) during the application of SNX-482 (0.1 μm). EPSCs were evoked every 15 s. Amplitude is expressed as a percentage of EPSC1 amplitude determined before the application of SNX-482. SNX-482 was applied by perfusion (as indicated by a horizontal bar). Each point represents the mean ± SEM (n = 6–9). F, G, Summary of PPRamp (F) and PPRdecay (G) before (control, white columns) and during treatment with SNX-482 (black columns), thapsigargin (gray columns), or BAPTA (hatched gray columns). Each column represents the mean ± SEM (n = 7–9). *p < 0.05.
Figure 4.
Figure 4.
Roscovitine enhances PPRdecay at GC-MLI synapses. A, Effects of roscovitine (30 μm) on GC-MLI synaptic transmission. Paired EPSCs were evoked at 30 ms of ISI. Five EPSCs recorded from a single MLI before (left) and after (middle) the application of roscovitine are superimposed. The traces are averaged and scaled to peak on the right. B, C, Time course of changes in the amplitude (B) and the τdecay (C) of EPSC1 (white circles) and EPSC2 (black circles) during the application of roscovitine (30 μm). Pairs of EPSCs (ISI of 30 ms) were evoked every 15 s by test stimulation. Amplitude is expressed as a percentage of EPSC1 amplitude determined before drug application. Roscovitine was applied for 10 min by perfusion (as indicated by a horizontal bar). Each point represents the mean ± SEM (n = 8–10). D, E, Summary of PPRamp (D) and PPRdecay (E) before (control, white columns) and after (black columns) treatment with roscovitine. Each column represents the mean ± SEM (n = 8). **p < 0.01. FH, Summary of the effects of roscovitine (black columns) on EPSC2 kinetics as fitted by a double-exponential function. Each column represents the mean ± SEM (n = 8). *p < 0.05.
Figure 5.
Figure 5.
Effects of subtype-selective Cav2 channel blockers on roscovitine action. A, Left three traces, Five first EPSCs recorded from a single MLI during successive application of AgTX (0.1 μm) and roscovitine (30 μm). Right, Averaged traces are scaled to the same peak amplitude. B, C, Time course of changes in the amplitude (B) and τdecay (C) of EPSC1 (white circles) and EPSC2 (black circles) during the application of AgTX (0.1 μm) and roscovitine (30 μm). Pairs of EPSCs (ISI of 30 ms) were evoked every 15 s. Amplitude is expressed as a percentage of EPSC1 amplitude determined before the application of AgTX. AgTX and roscovitine were applied for 10 min by perfusion (as indicated by a horizontal bar). Each point represents the mean ± SEM (n = 8). D, E, Time course of changes in the amplitude (D) and τdecay (E) of EPSC1 (white circles) and EPSC2 (black circles) during successive application of CgTX (1 μm) and roscovitine (30 μm). Amplitude is expressed as a percentage of EPSC1 amplitude determined before CgTX application. Roscovitine and CgTX were applied for 10 min by perfusion (indicated by the horizontal bar). Each point represents the mean ± SEM (n = 9).
Figure 6.
Figure 6.
Effects of roscovitine on the rising phase of GC-MLI EPSC. A, Fifty consecutive EPSCs recorded from a single MLI before (left) and after (right) roscovitine (30 μm) treatment are shown. An averaged trace is indicated by a gray line. B, Superimposed averaged traces of the stimulus artifact and EPSC1 onset before (control, gray trace) and after (black trace) treatment with roscovitine (same data as in A). Horizontal arrows show latency to EPSC1 onset (C, control; R, roscovitine). C, Superimposed averaged traces showing EPSC1 onset and peak before (control, gray trace) and after (black trace) roscovitine treatment are scaled to the same peak amplitude and aligned at the rising phase (same data as in A). Horizontal arrows show the time-to-peak from EPSC onset. D, Summary of EPSC1 kinetics recorded before (white columns) and after (black columns) roscovitine treatment. Each column represents the mean ± SEM (n = 10). *p < 0.05.
Figure 7.
Figure 7.
Effects of roscovitine on asynchronously occurring EPSCs at GC-MLI synapses. A, Effects of roscovitine (30 μm) on asynchronous EPSCs recorded from a single MLI. Asynchronous EPSCs were evoked by single pulses to GC axons at least 15 min after the perfusion of Sr2+-containing ACSF; three successive sweeps before (left) and during (right) roscovitine treatment are shown. BD, Summary of the frequency (B), mean amplitude (C), and mean τdecay (D) of asynchronized EPSCs recorded before (white columns) and after (black columns) the application of roscovitine. All asynchronous EPSCs analyzed were collected during a 300 ms window starting from the stimulus. Each column represents the mean ± SEM (n = 9). ***p < 0.001.
Figure 8.
Figure 8.
Roscovitine enhances MVR glutamate at GC-MLI synapses. A, Effect of sequential application of roscovitine (30 μm) and γ-DGG (200 μm) on GC-MLI EPSC. Paired EPSCs were evoked with an ISI of 30 ms. The low-affinity competitive glutamate receptor antagonist γ-DGG was applied after roscovitine-induced potentiation. Left three traces, Five successive EPSC1s recorded from a single MLI before (left) and after the application of roscovitine (middle) and γ-DGG (right) are superimposed. Right, Averaged traces of EPSC1 before and after roscovitine treatment are scaled to the same peak amplitude. B, C, Time course of changes in the amplitude (B) and τdecay (C) of EPSC1 (white circles) and EPSC2 (black circles) during the application of roscovitine (30 μm) and γ-DGG (200 μm). EPSCs were evoked every 15 s by test stimulation. Amplitude is expressed as a percentage of EPSC1 amplitude determined before the application of roscovitine. Roscovitine and γ-DGG were applied for 10 min by perfusion (as indicated by horizontal bars). Each point represents the mean ± SEM (n = 8–10). D, E, Summary of the inhibitory effects of γ-DGG on the amplitude (D) and τdecay (E) of EPSC1 and EPSC2 (ISI of 30 ms). Each column represents the mean ± SEM (n = 11–13). *p < 0.05.
Figure 9.
Figure 9.
Contribution of free Ca2+ accumulation to PPPdecay at GC-MLI synapses. A, Top, Effects of the slow Ca2+ chelator EGTA-AM (100 μm) on GC-MLI synaptic transmission. GC axons were stimulated with paired pulses (ISI of 30 ms). Left two traces, Five successive EPSC pairs recorded from a single MLI before (left) and after (middle) treatment with the Ca2+ chelator are superimposed. Right, After averaging, the depressed EPSC1 (black trace) was scaled to the control EPSC1 (gray trace) and superimposed. Bottom, Averaged traces of EPSC1 (gray traces) and EPSC2 (black traces) are scaled to the same peak amplitude. B, C, Time course of changes in the amplitude (B) and τdecay (C) of EPSC1 (white circles) and EPSC2 (black circles) during the application of EGTA-AM (100 μm). EPSCs were evoked every 15 s by test stimulation. Amplitude is expressed as a percentage of EPSC1 amplitude determined before the application of EGTA-AM. EGTA-AM was applied for 10 min by perfusion (as indicated by a horizontal bar). Each point represents the mean ± SEM (n = 8). D, E, EGTA-AM decreases both PPRamp (D) and PPRdecay (E). Each column represents the mean ± SEM (n = 8). **p < 0.01, *p < 0.05. FH, Summary of the effects of EGTA-AM (black columns) on EPSC2 kinetics as fitted by a double-exponential function. Each column represents the mean ± SEM (n = 8).
Figure 10.
Figure 10.
Effect of sequential application of EGTA-AM and subtype-selective Cav2 channel blockers on GC-MLI EPSC. A, B, Top two traces, Five paired EPSCs (ISI of 30 ms) recorded from a single MLI during successive application of EGTA-AM (100 μm, control) and AgTX (0.1 μm, A) or CgTX (1 μm, B). Bottom, Averaged traces of EPSC1 are scaled to the same peak amplitude. Each Cav2 channel blocker was applied after EGTA-AM-induced depression. CF, Time course of changes in the amplitude (C, E) and τdecay (D, F) of EPSC1 (white circles) and EPSC2 (black circles) during the application of EGTA-AM (100 μm) and AgTX (0.1 μm; C, D) or CgTX (1 μm; E, F). EPSCs were evoked every 15 s by test stimulation. Amplitude is expressed as a percentage of EPSC1 amplitude determined before the application of EGTA-AM. EGTA-AM and the Cav2 channel blocker were applied for 10 min by perfusion (as indicated by a horizontal bar). Each point represents the mean ± SEM (n = 9). GJ, Summary of PPRamp (G, I) and PPRdecay (H, J) examined with an ISI of 30 ms before (ACSF, white columns) and after treatment with EGTA-AM (control, gray columns) and AgTX (G, H, black columns) or CgTX (I, J, black columns). Each column represents the mean ± SEM (n = 9). **p < 0.01.
Figure 11.
Figure 11.
Proposed mechanisms underlying PPFamp and PPPdecay at rat cerebellar GC-MLI synapses. A, B, Cav2.1 channels are activated by a single AP, thereby eliciting Ca2+ influx into the GC axon terminal and subsequent vesicular release (the first release). C, If the interval to the second AP is short, intracellular Ca2+ will accumulate, possibly augmented by use-dependent facilitation of the Cav2.1 channel and/or occupation of endogenous Ca2+ buffers. D, The accumulated free Ca2+ permits the activation of Ca2+ sensors located more distant from the Cav2.1 channel, thereby increasing the number of released vesicles (the second release; MVR and PPFamp). A considerable amount of glutamate spills out from the synaptic cleft, leading to intersynaptic pooling of glutamate among active GC synapses (PPPdecay).

Similar articles

Cited by

References

    1. Adams PJ, Rungta RL, Garcia E, van den Maagdenberg AM, MacVicar BA, Snutch TP. Contribution of calcium-dependent facilitation to synaptic plasticity revealed by migraine mutations in the P/Q-type calcium channel. Proc Natl Acad Sci U S A. 2010;107:18694–18699. doi: 10.1073/pnas.1009500107. - DOI - PMC - PubMed
    1. Atluri PP, Regehr WG. Determinants of the time course of facilitation at the granule cell to Purkinje cell synapse. J Neurosci. 1996;16:5661–5671. - PMC - PubMed
    1. Atluri PP, Regehr WG. Delayed release of neurotransmitter from cerebellar granule cells. J Neurosci. 1998;18:8214–8227. - PMC - PubMed
    1. Auger C, Kondo S, Marty A. Multivesicular release at single functional synaptic sites in cerebellar stellate and basket cells. J Neurosci. 1998;18:4532–4547. - PMC - PubMed
    1. Augustine GJ. How does calcium trigger neurotransmitter release? Curr Opin Neurobiol. 2001;11:320–326. doi: 10.1016/S0959-4388(00)00214-2. - DOI - PubMed

Publication types

Substances

LinkOut - more resources