. 2014 Jan 22;4(1):130190.
doi: 10.1098/rsob.130190.

Anillin-dependent organization of septin filaments promotes intercellular bridge elongation and Chmp4B targeting to the abscission site

Affiliations

Anillin-dependent organization of septin filaments promotes intercellular bridge elongation and Chmp4B targeting to the abscission site

Matthew J Renshaw et al. Open Biol. .

Abstract

The final step of cytokinesis is abscission when the intercellular bridge (ICB) linking the two new daughter cells is broken. Correct construction of the ICB is crucial for the assembly of factors involved in abscission, a failure in which results in aneuploidy. Using live imaging and subdiffraction microscopy, we identify new anillin-septin cytoskeleton-dependent stages in ICB formation and maturation. We show that after the formation of an initial ICB, septin filaments drive ICB elongation during which tubules containing anillin-septin rings are extruded from the ICB. Septins then generate sites of further constriction within the mature ICB from which they are subsequently removed. The action of the anillin-septin complex during ICB maturation also primes the ICB for the future assembly of the ESCRT III component Chmp4B at the abscission site. These studies suggest that the sequential action of distinct contractile machineries coordinates the formation of the abscission site and the successful completion of cytokinesis.

Keywords: cell division; cytokinesis; high-resolution microscopy; mitosis.


Figures
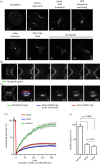
Figure 1.
Figure 1.
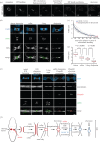
Anillin dynamics during cytokinesis. (a) Micrographs from a time-lapse series taken of HeLa cells expressing GFP-anillin from the point of entry into anaphase through to abscission. Numbers are minutes from the onset of anaphase. Scale bar, 5 μm. (b) Micrographs from a time-lapse series taken of a HeLa cell expressing GFP-anillin before and after a region (green circle) of the plasma membrane in the furrow was bleached. The first panel shows both forming daughter cells, and the subsequent panels are a magnification of the boxed region of the first panel. Scale bar, 2 μm. (c) Micrographs from a time-lapse series taken of a HeLa cell expressing GFP-anillin before and after a region (green circle) of the ICB encompassing the central anillin ring (blue rectangle) and one anillin ring at a constriction site (red rectangle) were bleached. The first panel shows both forming daughter cells, and the subsequent panels are a magnification of the boxed region of the first panel. Scale bar, 2 μm. (d) Graph following the recovery of GFP-anillin fluorescence after the photobleaching described in (b,c). (e) Comparison of the mobile fractions of GFP-anillin in each region. Mean ± s.e.m. is shown.
Figure 2.
Figure 2.
The ICB forms through a series of defined organizational states. (a) Micrographs from a time-lapse series taken of HeLa cells expressing GFP-tubulin from the point of entry into anaphase through to abscission. Numbers are minutes from the onset of anaphase. Scale bar, 5 μm. (b) Micrographs of fixed HeLa cells stained with anti-anillin and anti-tubulin antibodies. Scale bar, 5 μm in whole cell images and 1 μm in magnified images. (c) Measurement of the width of the microtubule bundle in the ICB overtime. Grey lines are traces from individual cells, the blue line the average. (d) ICB microtubule width during different anillin organization states. Furrow, n = 17, collar, n = 28, three-ring, n = 15 and dissipation, n = 38. Red line is the median and the boxes mark the 25th–75th percentile range. (e) Stably expressing GFP-tubulin HeLa cells were fixed and stained with anti-anillin and anti-Chmp4B antibodies. The organizational state of GFP-microtubules in fixed cells was compared with that observed in live imaging, (b), to order the ICBs in increasing states of maturity from left to right. White arrows point to the three anillin rings. Scale bar, 5 μm in whole cell images and 1 μm in magnified images. (f) Schematic outlining the different stages of anillin (red) and ESCRT III (blue) organization during cytokinesis. MT, microtubule.
Figure 3.
Figure 3.
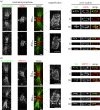
Anillin-dependent recruitment of septins is required for ICB elongation. (a) Time-lapse series of HeLa cells expressing GFP-anillin or GFP-anillinΔPH + PLCδ PH as the only forms of cellular anillin during the ICB elongation phase of cytokinesis. Left-hand panel, full cell view, scale bar, 5 μm; right-hand panels, magnified views of the ICB, scale bar, 1 μm. Time 0 is the point of initial ICB formation. (b) Length of anillin–septin collar over time during the ICB elongation phase in HeLa cells expressing GFP-anillin (black, n = 12) or GFP-anillinΔPH + PLCδ PH (grey, n = 8) as the only forms of cellular anillin. (c) Histogram of maximum anillin ICB collar lengths in HeLa cells overexpressing GFP-anillin, WT + GFP-anillin, HeLa cells expressing GFP-anillin or GFP-anillinΔPH + PLCδ PH as the only forms of cellular anillin and GFP-anillin expressing HeLa cell depleted of SEPT9, GFP-anillin SEPT9 RNAi. (d) Histogram of the minimum diameter of ICBs in cells expressing different forms of anillin at different levels. WT, wild-type.
Figure 4.
Figure 4.
Subdiffraction microscopy images of anillin and septin organization in ICB during their elongation phase. (a) TCA fixed Hela cells stained with anti-tubulin (Tub) and anti-anillin antibodies. Left-hand panels are maximum projections, right-hand panels are cross section though different points of the ICB marked I, II and III. Scale bar, 1 μm. (b) TCA fixed HeLa cells stained with anti-tubulin and anti-SEPT 11 antibodies. Left-hand panels are maximum projections, right-hand panels are cross section though different points of the ICB marked I, II and III. Scale bar, 1 μm.
Figure 5.
Figure 5.
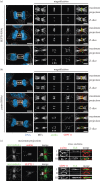
SEPT9 is not required for ICB formation. (a) Localization of anillin and SEPT11 in the absence of SEPT9 in ICBs of increasing maturity. White arrows point to the three discrete rings of the three-ring stage of anillin organization. Scale bar, 5 μm. (b) Localization of anillin and SEPT11 in absence of endogenous SEPT9 in ICBs of increasing maturity. White arrows point to the three discrete rings of the three-ring stage of anillin organization. Scale bar, 5 μm. (c) 3D-SIM images of TCA fixed Hela cells transfected with SEPT9 RNAi stained with anti-tubulin and anti-anillin or anti-SEPT11 antibodies. Left-hand panels are maximum projections, right-hand panels are cross section though different points of the ICB marked I, II and III. Scale bar, 5 μm.
Figure 6.
Figure 6.
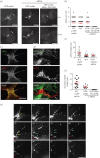
Tubules are extruded from ICBs during the elongation phase. (a) Images of tubules in HeLa cells expressing GFP-anillin or GFP-anillinΔPH + PLCδ PH from both TCA fixed and live samples. Arrows point to tubules. Scale bar, 5 μm. (b) Quantitation of the number of tubules observed in TCA fixed HeLa cells expressing different forms and levels of anillin. Overexpression of anillin (WT + GFP-anillin, n = 39), endogenous anillin (WT, n = 52), only GFP-anillin (n = 35) and only GFP-anillinΔPH + PLCδ PH (n = 32, respectively). (c) Subdiffraction microscopy of TCA fixed HeLa cells stained with anillin and SEPT11 antibodies showing an early stage ICB tubule. Scale bar, 5 μm. (d) Subdiffraction microscopy of TCA-fixed HeLa cells stained with anti-anillin and tubulin antibodies showing a late stage ICB tubule. Scale bar, 5 μm. (e) Tubule lengths in TCA-fixed HeLa cells expressing different forms and levels of anillin outlined in (b). (f) Quantification of the maximum observed length of ICB tubules during time-lapse imaging analysis of HeLa cell overexpressing GFP-anillin (WT + GFP-anillin, n = 11) or in the presence of siRNA expressing GFP-anillin (n = 9) or GFP-anillinΔPH + PLCδ PH (n = 11). (g) Time-lapse series of a HeLa cell expressing GFP-anillin focusing on the tubule extrusion phase. Numbers are minutes from an arbitrary starting point. Yellow arrow points to a tubule attached to the ICB. Blue arrow points to the same tubule that is now moving to one daughter cell. Red arrow marks the central of the three-anillin rings that defines the stem body. Scale bars, 5 μm.
Figure 7.
Figure 7.
Anillin-dependent recruitment of septins to the ICB is required for constriction site ingression. (a) ICBs stained for microtubules and RacGAP in HeLa cells expressing GFP-anillin or GFP-anillinΔPH + PLCδ PH as the only forms of cellular anillin. Scale bar, 1 μm. (b) Quantification of fluorescence intensity along cross sections of ICBs (see I panel c) stained for tubulin (black), anillin (green) and RacGAP (red). n = 10. II, III and IV indicate the position of the cross sections in (c). (c) A ICB stained using antibodies to detect tubulin, anillin and RacGAP and viewed as a maximum projection and single Z-section in the x-, y- and z-planes as indicated. Scale bar, 1 μm. (d) Cartoon outlining the different ICB parameters measured in (e) and the spatial relationship of those rings to each other within the ICB. (e) Measurement of the diameter of the different rings in the three-ring anillin stage of ICB maturation.
Figure 8.
Figure 8.
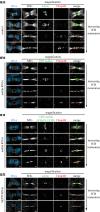
Anillin-dependent recruitment of septins to the ICB is required for Chmp4B localization to the abscission site. (a) Images of ICBs with an increasing degree of maturation stained for anillin, tubulin and Chmp4B. (a) Images of ICBs with an increasing degree of maturation expressing GFP-anillin as the only form of anillin and stained for tubulin and Chmp4B. (c) Images of ICBs with an increasing degree of maturation expressing GFP-anillinΔPH + PLCδ PH as the only form of anillin and stained for tubulin and Chmp4B. (d) Images of ICBs with an increasing degree of maturation in HeLa cells depleted of SEPT9 stained for anillin, tubulin and Chmp4B. Bar in whole cell images, left-hand side is 5 μm, Bar in magnified images is 1 μm.

Similar articles

Cited by

References

    1. Fededa JP, Gerlich DW. 2012. Molecular control of animal cell cytokinesis. Nat. Cell Biol. 14, 440–447. (doi:10.1038/ncb2482) - DOI - PubMed
    1. Green RA, Paluch E, Oegema K. 2012. Cytokinesis in animal cells. Annu. Rev. Cell Dev. Biol. 28, 29–58. (doi:10.1146/annurev-cellbio-101011-155718) - DOI - PubMed
    1. Gordon DJ, Resio B, Pellman D. 2012. Causes and consequences of aneuploidy in cancer. Nat. Rev. Genet. 13, 189–203. (doi:10.1038/nrg3123) - DOI - PubMed
    1. Holland AJ, Cleveland DW. 2012. Losing balance: the origin and impact of aneuploidy in cancer. EMBO Rep. 13, 501–514. (doi:10.1038/embor.2012.55) - DOI - PMC - PubMed
    1. Eggert US, Field CM, Mitchison TJ. 2006. Animal cytokinesis: from parts list to mechanisms. Annu. Rev. Biochem. 75, 543–566. (doi:10.1146/annurev.biochem.74.082803.133425) - DOI - PubMed

Publication types

MeSH terms

LinkOut - more resources