Functional cross-talk between ras and rho pathways: a Ras-specific GTPase-activating protein (p120RasGAP) competitively inhibits the RhoGAP activity of deleted in liver cancer (DLC) tumor suppressor by masking the catalytic arginine finger
- PMID: 24443565
- PMCID: PMC3945346
- DOI: 10.1074/jbc.M113.527655
Functional cross-talk between ras and rho pathways: a Ras-specific GTPase-activating protein (p120RasGAP) competitively inhibits the RhoGAP activity of deleted in liver cancer (DLC) tumor suppressor by masking the catalytic arginine finger
Abstract
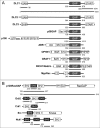
The three deleted in liver cancer genes (DLC1-3) encode Rho-specific GTPase-activating proteins (RhoGAPs). Their expression is frequently silenced in a variety of cancers. The RhoGAP activity, which is required for full DLC-dependent tumor suppressor activity, can be inhibited by the Src homology 3 (SH3) domain of a Ras-specific GAP (p120RasGAP). Here, we comprehensively investigated the molecular mechanism underlying cross-talk between two distinct regulators of small GTP-binding proteins using structural and biochemical methods. We demonstrate that only the SH3 domain of p120 selectively inhibits the RhoGAP activity of all three DLC isoforms as compared with a large set of other representative SH3 or RhoGAP proteins. Structural and mutational analyses provide new insights into a putative interaction mode of the p120 SH3 domain with the DLC1 RhoGAP domain that is atypical and does not follow the classical PXXP-directed interaction. Hence, p120 associates with the DLC1 RhoGAP domain by targeting the catalytic arginine finger and thus by competitively and very potently inhibiting RhoGAP activity. The novel findings of this study shed light on the molecular mechanisms underlying the DLC inhibitory effects of p120 and suggest a functional cross-talk between Ras and Rho proteins at the level of regulatory proteins.
Keywords: Arginine Finger; DLC1; Deleted in Liver Cancer; GTPase; Kinetics; Molecular Modeling; RhoGAP; SH3 Domains; Structural Biology; p120RasGAP.
Figures


Similar articles
-
SH3 domain regulation of RhoGAP activity: Crosstalk between p120RasGAP and DLC1 RhoGAP.Nat Commun. 2022 Aug 15;13(1):4788. doi: 10.1038/s41467-022-32541-4. Nat Commun. 2022. PMID: 35970859 Free PMC article.
-
p120Ras-GAP binds the DLC1 Rho-GAP tumor suppressor protein and inhibits its RhoA GTPase and growth-suppressing activities.Oncogene. 2009 Mar 19;28(11):1401-9. doi: 10.1038/onc.2008.498. Epub 2009 Jan 19. Oncogene. 2009. PMID: 19151751 Free PMC article.
-
Oncogenic inhibition by a deleted in liver cancer gene requires cooperation between tensin binding and Rho-specific GTPase-activating protein activities.Proc Natl Acad Sci U S A. 2007 May 22;104(21):9012-7. doi: 10.1073/pnas.0703033104. Epub 2007 May 15. Proc Natl Acad Sci U S A. 2007. PMID: 17517630 Free PMC article.
-
p120-Ras GTPase activating protein (RasGAP): a multi-interacting protein in downstream signaling.Biochimie. 2009 Mar;91(3):320-8. doi: 10.1016/j.biochi.2008.10.010. Epub 2008 Oct 30. Biochimie. 2009. PMID: 19022332 Review.
-
Regulation of deleted in liver cancer 1 tumor suppressor by protein-protein interactions and phosphorylation.Int J Cancer. 2014 Jul 15;135(2):264-9. doi: 10.1002/ijc.28505. Epub 2013 Oct 17. Int J Cancer. 2014. PMID: 24114040 Review.
Cited by
-
SH3 domain regulation of RhoGAP activity: Crosstalk between p120RasGAP and DLC1 RhoGAP.Nat Commun. 2022 Aug 15;13(1):4788. doi: 10.1038/s41467-022-32541-4. Nat Commun. 2022. PMID: 35970859 Free PMC article.
-
SRC and ERK cooperatively phosphorylate DLC1 and attenuate its Rho-GAP and tumor suppressor functions.J Cell Biol. 2019 Sep 2;218(9):3060-3076. doi: 10.1083/jcb.201810098. Epub 2019 Jul 15. J Cell Biol. 2019. PMID: 31308216 Free PMC article.
-
The potential therapeutic roles of Rho GTPases in substance dependence.Front Mol Neurosci. 2023 Mar 30;16:1125277. doi: 10.3389/fnmol.2023.1125277. eCollection 2023. Front Mol Neurosci. 2023. PMID: 37063367 Free PMC article.
-
Modeling the effect of prolonged ethanol exposure on global gene expression and chromatin accessibility in normal 3D colon organoids.PLoS One. 2020 Jan 17;15(1):e0227116. doi: 10.1371/journal.pone.0227116. eCollection 2020. PLoS One. 2020. PMID: 31951625 Free PMC article.
-
Novel Tools towards Magnetic Guidance of Neurite Growth: (I) Guidance of Magnetic Nanoparticles into Neurite Extensions of Induced Human Neurons and In Vitro Functionalization with RAS Regulating Proteins.J Funct Biomater. 2019 Jul 16;10(3):32. doi: 10.3390/jfb10030032. J Funct Biomater. 2019. PMID: 31315182 Free PMC article.
References
-
- Aznar S., Lacal J. C. (2001) Searching new targets for anticancer drug design: the families of Ras and Rho GTPases and their effectors. Prog. Nucleic Acid Res. Mol. Biol. 67, 193–234 - PubMed
-
- Fritz G., Just I., Kaina B. (1999) Rho GTPases are over-expressed in human tumors. Int. J. Cancer 81, 682–687 - PubMed
-
- Pruitt K., Der C. J. (2001) Ras and Rho regulation of the cell cycle and oncogenesis. Cancer Lett. 171, 1–10 - PubMed
-
- Sahai E., Marshall C. J. (2002) RHO-GTPases and cancer. Nat. Rev. Cancer 2, 133–142 - PubMed
Publication types
MeSH terms
Substances
LinkOut - more resources
Full Text Sources
Other Literature Sources
Research Materials
Miscellaneous

