. 2014 Jan;66(1):107-20.
doi: 10.1002/art.38195.

Chondrocyte β-catenin signaling regulates postnatal bone remodeling through modulation of osteoclast formation in a murine model

Affiliations

Chondrocyte β-catenin signaling regulates postnatal bone remodeling through modulation of osteoclast formation in a murine model

Baoli Wang et al. Arthritis Rheumatol. 2014 Jan.

Erratum in

Abstract

Objective: To investigate whether β-catenin signaling in chondrocytes regulates osteoclastogenesis, thereby contributing to postnatal bone growth and bone remodeling.

Methods: Mice with conditional knockout (cKO) or conditional activation (cAct) of chondrocyte-specific β-catenin were generated. Changes in bone mass, osteoclast numbers, and osteoblast activity were examined. The mechanisms by which β-catenin signaling in chondrocytes regulates osteoclast formation were determined.

Results: The β-catenin cKO mice developed localized bone loss, whereas cAct mice developed a high bone mass phenotype. Histologic findings suggested that these phenotypes were caused primarily by impaired osteoclast formation, rather than impaired bone formation. Further molecular signaling analyses revealed that β-catenin signaling controlled this process by regulating the expression of the RANKL and osteoprotegerin (OPG) genes in chondrocytes. Activation of β-catenin signaling in chondrocytes suppressed Rankl gene transcription through a glucocorticoid receptor-dependent mechanism. The severe bone loss phenotype observed in β-catenin cKO mice was largely restored by treatment with human recombinant OPG or transgenic overexpression of Opg in chondrocytes.

Conclusion: β-catenin signaling in chondrocytes plays a key role in postnatal bone growth and bone remodeling through its regulation of osteoclast formation.


Figures

Figure 1
Figure 1
Reduced bone mass in mice with conditional knockout (cKO) of chondrocyte-specific β-catenin. A–C, Radiographic imaging (A) and micro–computed tomography imaging (B and C) display evidence of bone loss in the proximal metaphysis of the long bones of 3-month-old β-catenin cKO mice compared with Cre-negative control littermates. Red arrows indicate areas with bone destruction, and green arrows indicate areas with normal bone structure. D–I, Histomorphometric analyses show changes in bone parameters, such as bone volume (bone volume/total volume [BV/TV]) (D), bone mineral density (BMD) (bone mineral content/total volume [BC/TV]) (E), trabecular number (Tb.N.) (F), trabecular separation (Tb.Sp.) (G), structural model index (SMI) (H), and cortical thickness (Th.) (I), in cKO mice compared with controls (n = 8 per group). J, Histologic analysis shows reductions in the trabecular and cortical bone volumes of the proximal metaphysis of cKO mice compared with controls. Lower panels (a and b) are higher-magnification views of the boxed areas. K, Disorganization of growth plate chondrocytes is evident in the tibiae of 3-month-old cKO mice compared with controls. Lower panels (a and b) are higher-magnification views of the boxed areas. L, Immunohistochemical staining shows decreased β-catenin protein levels in the growth plate chondrocytes of cKO mice compared with controls. Arrows indicate β-catenin–positive cells. M, Real-time polymerase chain reaction analysis shows that chondrocyte marker gene expression is reduced in cKO mice compared with controls (n = 3 per group). N, Immunohistochemical staining shows that type X collagen (ColX) protein expression is reduced in the hypertrophic zone of the growth plates of cKO mice compared with controls. Arrows indicate ColX–positive hypertrophic chondrocytes. Results are the mean ± SD. * = P < 0.05 versus controls, by Student’s unpaired t-test.
Figure 2
Figure 2
Increased bone mass in mice with conditional activation (cAct) of chondrocyte-specific β-catenin. A, The body size of a 1-month-old cAct mouse was smaller than that of a 1-month-old Cre-negative control littermate. B, Micro–computed tomography (micro-CT) imaging of the tibiae shows areas of high bone mass (arrows) under the growth plate of a 1-month-old cAct mouse compared with a control mouse. With increasing age in cAct mice (2 months and 3 months old), the high bone mass area was separated from the growth plate. C–H, Findings of micro-CT show that bone parameters, such as bone volume (C), bone mineral density (D), trabecular number (E), trabecular thickness (F), and connectivity density (H), were increased in 3-month-old cAct mice compared with controls. In contrast, trabecular separation (G) was decreased in cAct mice (n = 6 per group). I and J, Histologic staining of tibial sections (I) from 3-month-old mice reveals that the proximal metaphyseal bone volume (J) was increased in cAct mice compared with controls. In I, right panels (a and b) are higher-magnification views of the boxed areas. Arrows indicate high bone mass areas. K, Morphologic analysis reveals that the growth plate cartilage morphology (arrows) was disorganized in cAct mice compared with controls. L, Primary sternal chondrocytes were isolated from 3-day-old cAct mice and control littermates and cultured for 24 hours, followed by real-time polymerase chain reaction. The results show that expression of chondrocyte marker genes was increased in β-catenin–overexpressing mouse chondrocytes compared with controls (n = 3 per group). Results are the mean ± SD. * = P < 0.05 versus controls, by Student’s unpaired t-test. See Figure 1 for other definitions.
Figure 3
Figure 3
Changes in osteoclast formation in β-catenin–mutant mice. A–F, Tartrate-resistant acid phosphatase (TRAP) staining was performed on tibial tissue of 5-week-old β-catenin cKO mice (A–C) or cAct mice (D–F) and Cre-negative control mice. In cKO mice, the numbers of TRAP-positive multinucleated osteoclasts (A and B) and percentage of osteoclast surface (C) in the proximal metaphysis were increased relative to controls. In cAct mice, osteoclast numbers (D and E) and percentage of osteoclast surface (F) in the proximal metaphysis were decreased relative to controls. Arrows indicate TRAP-positive osteoclasts. G–I, Primary sternal chondrocytes were isolated from β-catenin cKO mice or control mice and treated with or without 4-hydroxytamoxifen, and expression of β-catenin was analyzed by Western blotting (G). The chondrocytes were then cocultured with spleen cells from 2-month-old C57 mice in the presence of macrophage colony-stimulating factor (M-CSF) and 1,25-dihydroxyvitamin D3 (1,25[OH]2D3). The increase in osteoclast numbers observed in the spleen cell–cKO mouse chondrocyte cocultures was reversed by addition of human recombinant osteoprotegerin (rOPG) (H and I). J–L, Expression of Opg, Rankl, and T cell factor 4 (TCF-4) was examined by real-time polymerase chain reaction (PCR) (J and K) and Western blotting (L) in cKO mouse chondrocytes compared with controls. M and N, Primary sternal chondrocytes were isolated from β-cateninflox(Ex3)/flox(Ex3) cKO or control mice and treated with or without 4-hydroxytamoxifen. Expression of floxed (F) or truncated (tr) β-catenin protein (M) and levels of nuclear β-catenin (N) were examined by Western blotting. Lamin A2 was used as a positive control in the Western blots. O–R, Chondrocytes from β-catenin cAct mice or control mice were cocultured with spleen cells isolated from wild-type mice in the presence of M-CSF and 1,25(OH)2D3. Osteoclast numbers (O and P) and expression of Opg (Q) and Rankl (R) in the spleen cell–chondrocyte cocultures were examined by real-time PCR. Results are the mean ± SD of 5 mice per group in B, C, E, and F, and 4 mice per group in I, J, K, P, and Q. * = P < 0.05 versus controls, by Student’s unpaired t-test. See Figure 1 for other definitions.
Figure 4
Figure 4
The β-catenin signaling pathway down-regulates Rankl expression in a GR-dependent manner. A–D, ATDC5 cells were cultured with Wnt-3a (50 μg/ml), LiCl (10 mM), or vehicle (A and B), transfected with β-catenin or control small interfering RNA (siRNA) (C), or treated with dexamethasone (Dex) (10−7M) or vehicle (D) for 12, 24, and 48 hours. The fold change in Rankl mRNA expression (A and C), Opg mRNA expression (B), and Rankl promoter activity (D) was significantly different between the groups after 24 or 48 hours of culture. E, Treatment of ATCD5 cells with dexamethasone enhanced Rankl mRNA expression at all time points. F, Transfection of ATDC5 cells with a mutant Rankl promoter construct (mutation of the GR binding site in the Rankl promoter) inhibited basal and dexamethasone-induced Rankl promoter activity, as compared to transfection with a wild-type (WT) reporter construct. G and H, Wnt-3a and LiCl inhibited GR mRNA expression in WT reporter–transfected cells (G) and inhibited Rankl promoter activity in WT reporter–transfected cells, but not in mutant (Mut) reporter–transfected cells (H). I and J, Transfection of cells with a Rankl-luc reporter construct and β-catenin siRNA up-regulated Rankl promoter activity (I), whereas treatment of these cells with Wnt-3a inhibited Rankl promoter activity (J). No effects were observed on empty vector–transfected cells. K, Interaction of β-catenin with GR was detected by chromatin immunoprecipitation (ChIP) assay. L, ChIP assay was performed using sonicated chromatin extracted from ATDC5 cells treated with either anti-GR antibody or normal rabbit IgG. Purified DNA was analyzed by standard polymerase chain reaction, using mouse Rankl–specific primer set 1 (−682/−562), which amplifies the fragment spanning the GR binding sequence (−647/−633). Primer set 2 was used as a negative control, amplifying a fragment downstream of the transcription start site (+2463/+2592). GR specifically binds to the proximal promoter region of the Rankl promoter, and treatment of cells with Wnt-3a inhibited GR binding to the Rankl promoter. Results are the mean ± SD of 3 mice per group. * = P < 0.05 versus controls, by Student’s unpaired t-test. WB = Western blotting.
Figure 5
Figure 5
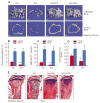
Treatment with human recombinant osteoprotegerin (rOPG) reverses the bone loss phenotype observed in β-catenin cKO mice. Two-week-old β-catenin cKO mice or Cre-negative control mice were treated with rOPG or phosphate buffered saline as vehicle control, after tamoxifen induction. A–D, Micro–computed tomography was used to analyze the effects of rOPG treatment on trabecular and cortical bone mass (A) and on the parameters of bone volume (B), bone mineral density (C), and cortical bone thickness (D) in β-catenin cKO and control mice. E, Histologic staining of tibial tissue also revealed the effects of rOPG on bone mass in β-catenin cKO and control mice. Results are the mean ± SD of 6 mice per group. * = P < 0.05 versus vehicle-treated mice in the same group; # = P < 0.05 versus Cre-negative control mice, by Student’s unpaired t-test. See Figure 1 for other definitions.
Figure 6
Figure 6
Overexpression of Opg reverses the bone loss phenotype observed in β-catenin cKO mice. A, Serum osteoprotegerin (OPG) production in Col2-Opg–transgenic mice and wild-type (WT) mice (n = 7 per group) was examined by enzyme-linked immunosorbent assay. B–E, Histologic staining of the tibiae of 2-week-old Col2-Opg–transgenic or WT mice (n = 5 per group) was used to assess formation of the secondary ossification center (B) and changes in bone mass (arrows) underneath the growth plate (C). In addition, osteoclast formation (arrows) was assessed by tartrate-resistant acid phosphatase (TRAP) staining in 4-week-old Col2-Opg–transgenic and WT mice (D and E). F–H, Col2a1-Opg–transgenic mice were bred with β-catenin cKO mice, and the tibiae of 3-month-old mice in each group (n = 6 per group) were assessed by micro–computed tomography for bone destruction (arrows) (F) and changes in bone volume (G) and bone mineral density (H). Results are the mean ± SD. * = P < 0.05 versus controls, by Student’s unpaired t-test. See Figure 1 for other definitions.

Similar articles

Cited by

References

    1. Villemure I, Stokes IA. Growth plate mechanics and mechanobiology: a survey of present understanding. J Biomech. 2009;42:1793–803. - PMC - PubMed
    1. Adams CS, Shapiro IM. The fate of the terminally differentiated chondrocyte: evidence for microenvironmental regulation of chondrocyte apoptosis. Crit Rev Oral Biol Med. 2002;13:465–73. - PubMed
    1. Gibson G. Active role of chondrocyte apoptosis in endochondral ossification. Microsc Res Tech. 1998;43:191–204. - PubMed
    1. Chen M, Zhu M, Awad H, Li TF, Sheu TJ, Boyce BF, et al. Inhibition of β-catenin signaling causes defects in postnatal cartilage development. J Cell Sci. 2008;121:1455–65. - PMC - PubMed
    1. Maeda Y, Nakamura E, Nguyen MT, Suva LJ, Swain FL, Razzaque MS, et al. Indian Hedgehog produced by postnatal chondrocytes is essential for maintaining a growth plate and trabecular bone. Proc Natl Acad Sci U S A. 2007;104:6382–7. - PMC - PubMed

Publication types

MeSH terms

LinkOut - more resources