Pathogen-related differences in the abundance of presented antigen are reflected in CD4+ T cell dynamic behavior and effector function in the lung
- PMID: 24431231
- PMCID: PMC3923305
- DOI: 10.4049/jimmunol.1301743
Pathogen-related differences in the abundance of presented antigen are reflected in CD4+ T cell dynamic behavior and effector function in the lung
Abstract
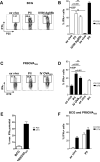
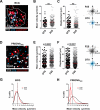
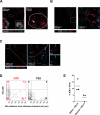
Exposure to pathogens in the periphery elicits effector T cell differentiation in local lymph nodes followed by migration of activated T cells to and within the infected site. However, the relationships among pathogen abundance, Ag display on MHC molecules, effector T cell dynamics, and functional responses at the infected sites are incompletely characterized. In this study, we compared CD4(+) T cell effector dynamics and responses during pulmonary mycobacterial infection versus acute influenza infection. Two-photon imaging together with in situ as well as ex vivo analysis of cytokine production revealed that the proportion of migration-arrested, cytokine-producing effector T cells was dramatically higher in the influenza-infected lungs due to substantial differences in Ag abundance in the two infectious states. Despite the marked inflammatory conditions associated with influenza infection, histocytometric analysis showed that cytokine production was focal, with a restriction to areas of significant Ag burden. Optimal effector function is thus constrained by the availability of TCR ligands, pointing to the value of increasing Ag stimulation rather than effector numbers in harnessing CD4(+) T cells for therapeutic purposes in such conditions.
Figures


Similar articles
-
CXCR6-Deficiency Improves the Control of Pulmonary Mycobacterium tuberculosis and Influenza Infection Independent of T-Lymphocyte Recruitment to the Lungs.Front Immunol. 2019 Mar 7;10:339. doi: 10.3389/fimmu.2019.00339. eCollection 2019. Front Immunol. 2019. PMID: 30899256 Free PMC article.
-
Suppressed induction of mycobacterial antigen-specific Th1-type CD4+ T cells in the lung after pulmonary mycobacterial infection.Int Immunol. 2010 Apr;22(4):307-18. doi: 10.1093/intimm/dxq010. Epub 2010 Feb 18. Int Immunol. 2010. PMID: 20167585
-
Pulmonary immune responses during primary mycobacterium bovis- Calmette-Guerin bacillus infection in C57Bl/6 mice.Am J Respir Cell Mol Biol. 2000 Mar;22(3):333-43. doi: 10.1165/ajrcmb.22.3.3776. Am J Respir Cell Mol Biol. 2000. PMID: 10696070
-
Division of labor between lung dendritic cells and macrophages in the defense against pulmonary infections.Mucosal Immunol. 2013 May;6(3):464-73. doi: 10.1038/mi.2013.14. Epub 2013 Apr 3. Mucosal Immunol. 2013. PMID: 23549447 Review.
-
T cell activation niches-Optimizing T cell effector function in inflamed and infected tissues.Immunol Rev. 2022 Mar;306(1):164-180. doi: 10.1111/imr.13047. Epub 2021 Dec 2. Immunol Rev. 2022. PMID: 34859453 Free PMC article. Review.
Cited by
-
ROCK regulates the intermittent mode of interstitial T cell migration in inflamed lungs.Nat Commun. 2017 Oct 18;8(1):1010. doi: 10.1038/s41467-017-01032-2. Nat Commun. 2017. PMID: 29044117 Free PMC article.
-
Activation of the aryl hydrocarbon receptor during development enhances the pulmonary CD4+ T-cell response to viral infection.Am J Physiol Lung Cell Mol Physiol. 2015 Aug 1;309(3):L305-13. doi: 10.1152/ajplung.00135.2015. Epub 2015 Jun 12. Am J Physiol Lung Cell Mol Physiol. 2015. PMID: 26071552 Free PMC article.
-
Generation of Monoclonal Antibodies against Ag85A Antigen of Mycobacterium tuberculosis and Application in a Competitive ELISA for Serodiagnosis of Bovine Tuberculosis.Front Vet Sci. 2017 Jun 30;4:107. doi: 10.3389/fvets.2017.00107. eCollection 2017. Front Vet Sci. 2017. PMID: 28713817 Free PMC article.
-
Lessons from other diseases: granulomatous inflammation in leishmaniasis.Semin Immunopathol. 2016 Mar;38(2):249-60. doi: 10.1007/s00281-015-0548-7. Epub 2015 Dec 17. Semin Immunopathol. 2016. PMID: 26678994 Free PMC article. Review.
-
Imaging CD8+ T cells during diverse viral infections.Intravital. 2015 Jun 19;4(1):e1055425. doi: 10.1080/21659087.2015.1055425. eCollection 2015 Jan-Apr. Intravital. 2015. PMID: 28243513 Free PMC article. Review.
References
-
- Bousso P. T-cell activation by dendritic cells in the lymph node: lessons from the movies. Nature reviews. Immunology. 2008;8:675–684. - PubMed
-
- Bousso P, Robey E. Dynamics of CD8+ T cell priming by dendritic cells in intact lymph nodes. Nature immunology. 2003;4:579–585. - PubMed
-
- Henrickson SE, von Andrian UH. Single-cell dynamics of T-cell priming. Current opinion in immunology. 2007;19:249–258. - PubMed
-
- Bartholomaus I, Kawakami N, Odoardi F, Schlager C, Miljkovic D, Ellwart JW, Klinkert WE, Flugel-Koch C, Issekutz TB, Wekerle H, Flugel A. Effector T cell interactions with meningeal vascular structures in nascent autoimmune CNS lesions. Nature. 2009;462:94–98. - PubMed
Publication types
MeSH terms
Substances
Grants and funding
LinkOut - more resources
Full Text Sources
Other Literature Sources
Research Materials

