. 2014 Feb 10;211(2):199-208.
doi: 10.1084/jem.20131038. Epub 2014 Jan 13.

Gata3 drives development of RORγt+ group 3 innate lymphoid cells

Affiliations

Gata3 drives development of RORγt+ group 3 innate lymphoid cells

Nicolas Serafini et al. J Exp Med. .

Abstract

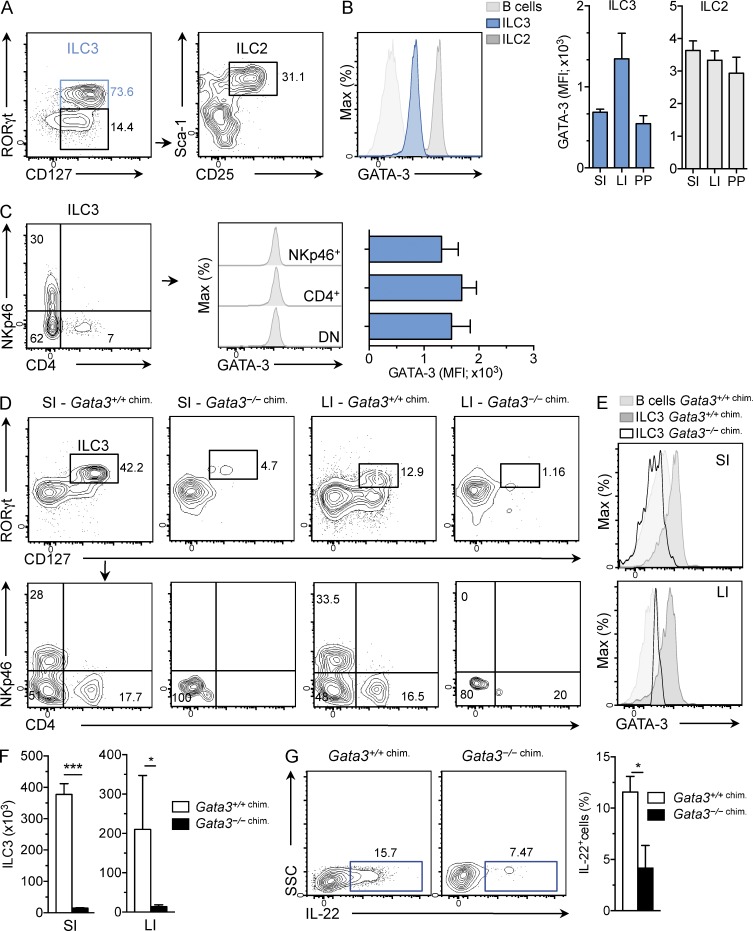
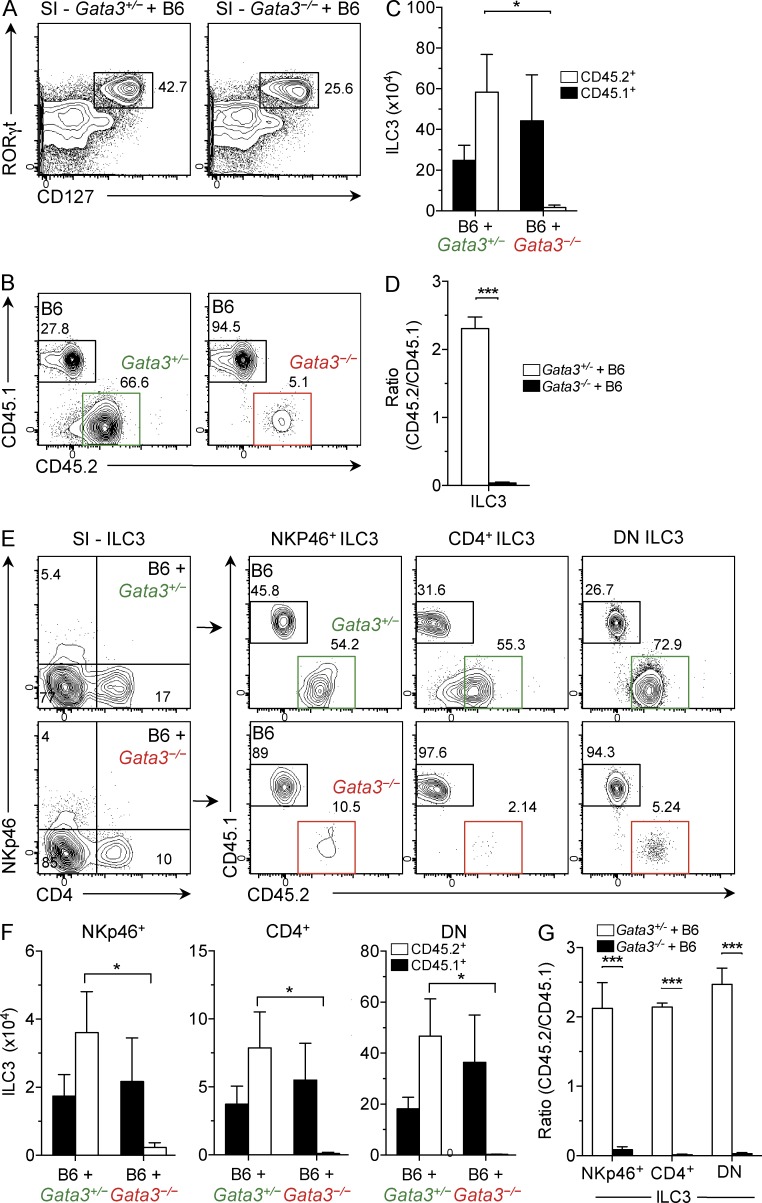
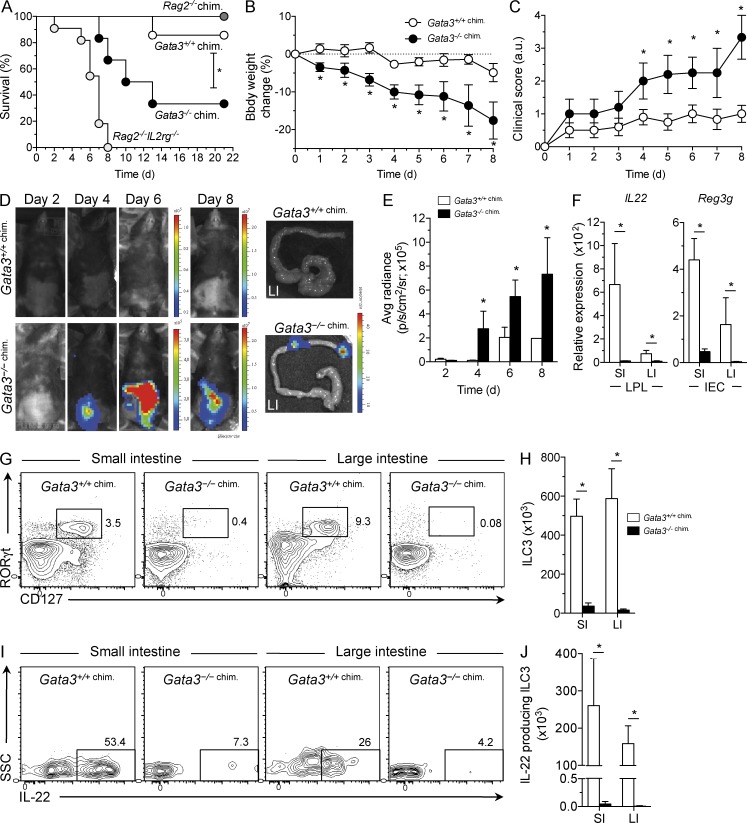
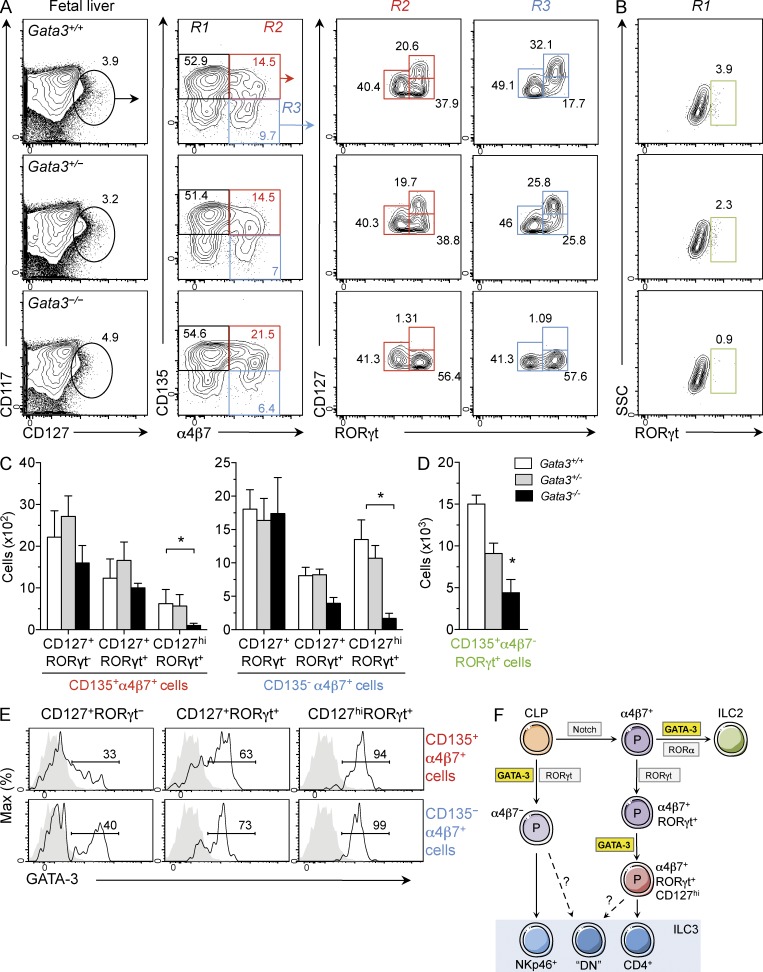
Group 3 innate lymphoid cells (ILC3) include IL-22-producing NKp46(+) cells and IL-17A/IL-22-producing CD4(+) lymphoid tissue inducerlike cells that express RORγt and are implicated in protective immunity at mucosal surfaces. Whereas the transcription factor Gata3 is essential for T cell and ILC2 development from hematopoietic stem cells (HSCs) and for IL-5 and IL-13 production by T cells and ILC2, the role for Gata3 in the generation or function of other ILC subsets is not known. We found that abundant GATA-3 protein is expressed in mucosa-associated ILC3 subsets with levels intermediate between mature B cells and ILC2. Chimeric mice generated with Gata3-deficient fetal liver hematopoietic precursors lack all intestinal RORγt(+) ILC3 subsets, and these mice show defective production of IL-22 early after infection with the intestinal pathogen Citrobacter rodentium, leading to impaired survival. Further analyses demonstrated that ILC3 development requires cell-intrinsic Gata3 expression in fetal liver hematopoietic precursors. Our results demonstrate that Gata3 plays a generalized role in ILC lineage determination and is critical for the development of gut RORγt(+) ILC3 subsets that maintain mucosal barrier homeostasis. These results further extend the paradigm of Gata3-dependent regulation of diversified innate ILC and adaptive T cell subsets.


Figures

Figure 1.
Figure 1.
Gata3 is required for ILC3 development. (A) Gating strategy for FACS analysis of mouse SI. ILC3 were gated on CD45.2+ CD3 CD90.2+ CD127+ RORγt+ cells and ILC2 were gated on CD45.2+ CD3 CD90.2+ CD127+ RORγtSca1+CD25+ cells. Numbers adjacent to boxed areas indicate relative percentage of gated populations. Representative results from four independent experiments (n = 8 mice analyzed). (B) GATA-3 protein expression in ILC3 (blue area), ILC2 (gray line and dark area), and CD19+ B cells (light gray area) in SI, LI (cecum and colon), and Peyer’s patches (PP) was analyzed by flow cytometry. Four independent experiments were performed. (C) GATA-3 expression in NKp46+, CD4+ LTi, and NKp46 CD4 (DN) ILC3 subsets. Representative histograms show intracellular expression of GATA-3 in ILC3 subsets (gray area) in SI. Bar graphs depict GATA-3 expression as measured by MFI in the different intestine ILC subsets analyzed in SI. Each bar corresponds to the mean ± SEM (n = 6 mice analyzed). (D) Rag2−/−IL2rg−/− CD45.1+ mice were transplanted with Gata3+/+ and Gata3−/− CD45.2+ precursors and ILC3 subsets in the SI and LI lamina propria were analyzed by flow cytometry. Numbers adjacent to boxed areas indicate relative percentage of gated populations. Representative results from three independent experiments with n = 6 total mice analyzed for each genotype. (E) Intracellular GATA-3 protein expression in ILC3 in Gata3+/+ (gray area) and Gata3−/− (black line) chimera was assessed by flow cytometry. Background staining was assessed in Gata3+/+ B cells (light gray area). Representative results from three independent experiments with n = 6 mice analyzed for each genotype. (F) Absolute numbers of ILC3 in SI and LI were determined in Gata3+/+ and Gata3−/− chimeras. Bars correspond to the mean ± SEM of the values obtained (3 independent experiments with n = 6 mice analyzed for each genotype). *, P < 0.05; ***, P < 0.001. (G) SI lamina propria cells were stimulated for 4 h with IL-23 and IL-22 expression in ILC3 (CD3CD127+CD90.2+ cells) was assessed by intracellular cytokine staining and flow cytometry. Bar graph represents the percentage (mean ± SEM; n = 4 for each genotype) of IL-22+ cells. Representative results from two independent experiments. *, P < 0.05.
Figure 2.
Figure 2.
Cell-intrinsic role for Gata3 in ILC3 development. Mixed chimeras were generated and analyzed as indicated in the Materials and methods. (A and B) ILC3 (CD3CD127+CD90.2+ cells) in SI lamina propria were analyzed for CD45 allotypes using flow cytometry. Relative percentage of gated populations is indicated. Representative results from two independent experiments. (C) Absolute numbers of SI ILC3 were determined in Gata3+/− and Gata3−/− mixed chimeras. Bars correspond to the mean ± SEM of the values obtained with five Gata3+/− and four Gata3−/− mixed chimeras (two independent experiments). *, P < 0.05. (D) Ratio of absolute numbers of CD45.2+ (Gata3+/− or Gata3−/−) to CD45.1+ (B6) ILC3 in SI. Each bar corresponds to the mean ± SEM of the values obtained with five Gata3+/− and four Gata3−/− mixed chimeras (two independent experiments). ***, P < 0.001. (E) Representative FACS analysis of ILC3 subsets in SI of Gata3+/+ and Gata3−/− mixed chimeras. ILC3 subsets were subsequently analyzed for expression of CD45 allotypes. (F) Absolute numbers of the indicated SI ILC3 subsets were determined in Gata3+/− and Gata3−/− mixed chimeras. Bars correspond to mean ± SEM of the values obtained with five Gata3+/− and four Gata3−/− mixed chimeras (two independent experiments). *, P < 0.05. (G) Ratio of the absolute numbers of CD45.2+ (Gata3+/− or Gata3−/−) and CD45.1+ (B6) SI ILC3 subsets in mixed chimeras. Bars correspond to the mean ± SEM of the values obtained with five Gata3+/− and four Gata3−/− mixed chimeras (two independent experiments). ***, P < 0.001.
Figure 3.
Figure 3.
Gata3 is required for resistance to C. rodentium infection. (A–D) Gata3+/+ (white circle; n = 10), Gata3−/− (black circle; n = 6) chimeras, Rag2−/− mice (dark gray circles; n = 8) and Rag2−/−IL2rg−/− mice (light gray circles; n = 8) were infected via oral gavage with 109 bioluminescent C. rodentium (CR) and survival (A), body weight (B), clinical score (C), and in vivo CR growth dynamics (D) were assessed at the indicated times after infection. Composite results from two independent experiments are shown. In pseudocolor images, red represents the most intense light emission and blue corresponds to the weakest signal (scale bar, photon/s/cm2/sr). Representative noninvasive CR imaging at 6 d after infection in Gata3+/+ and Gata3−/− chimera using Xenogen technology. (E) Relative growth of CR was determined in Gata3+/+ and Gata3−/− chimeras (n = 6 for each time point). *, P < 0.05. (F) Il22 and Reg3g expression was assessed by qRT-PCR in lamina propria cells (LPL) and intestinal epithelial cells (IEC), respectively, isolated from Gata3+/+ and Gata3−/− chimeras 6 d after CR infection (n = 4 for each genotype from two independent experiments). Results are represented relative to Gapdh expression (mean ± SEM). *, P < 0.05. (G–J) RORγt+ ILC3 (G and H) and IL-22–producing ILC3 (I and J) were determined in SI and LI from Gata3+/+ and Gata3−/− chimeras 6 d after CR infection. Relative percentage of gated populations is indicated. Bar graphs show quantification (mean ± SEM) of each population (H and J). *, P < 0.05. Representative results from two independent experiments (n = 4 for each genotype).
Figure 4.
Figure 4.
Characterization of RORγt+ cells in Gata3-deficient fetal liver cells. (A) Lymphohematopoietic precursors (CD3CD19GR-1CD11cTer119CD45.2+CD117+CD127+) in E12.5 fetal liver cells of Gata3+/+, Gata3+/−, and Gata3−/− mice were analyzed by flow cytometry. CD117+CD127+ fetal liver cells were gated for CD135 and α4β7 expression before analysis of CD127 and RORγt expression. RORγt versus CD127 expression on α4β7+ cells gated on CD135+ (R2; red box) or CD135 (R3; blue box). Representative results from three independent experiments. (B) Expression of RORγt (green box) was analyzed in CD135+α4β7 cells (R1; black box) in Gata3+/+, Gata3+/−, and Gata3−/− embryos. Representative results from three independent experiments. (C and D) Bar graph shows the quantification for each precursor subset. Each bar corresponds to the mean ± SEM of the values obtained from Gata3+/+, Gata3+/−, and Gata3−/− embryos (n = 7, 10, and 4, respectively). *, P < 0.05. (E) Representative histograms show intracellular expression of GATA-3 in ILC precursors (gray area for CD135+ α4β7 cells and black line for the others subsets) as indicated in the plots from E12.5 fetal liver. Representative results from three independent experiments. (F) Distinct roles for GATA-3 in ILC3 subset development. CLP generates ILC subsets under the influence of diverse transcription factors including RORγt, RORα, Notch, and GATA-3 as shown.

Similar articles

Cited by

References

    1. Ansel K.M., Djuretic I., Tanasa B., Rao A. 2006. Regulation of Th2 differentiation and Il4 locus accessibility. Annu. Rev. Immunol. 24:607–656 10.1146/annurev.immunol.23.021704.115821 - DOI - PubMed
    1. Banerjee A., Northrup D., Boukarabila H., Jacobsen S.E., Allman D. 2013. Transcriptional repression of Gata3 is essential for early B cell commitment. Immunity. 38:930–942 10.1016/j.immuni.2013.01.014 - DOI - PMC - PubMed
    1. Basu R., O’Quinn D.B., Silberger D.J., Schoeb T.R., Fouser L., Ouyang W., Hatton R.D., Weaver C.T. 2012. Th22 cells are an important source of IL-22 for host protection against enteropathogenic bacteria. Immunity. 37:1061–1075 10.1016/j.immuni.2012.08.024 - DOI - PMC - PubMed
    1. Bernink J.H., Peters C.P., Munneke M., te Velde A.A., Meijer S.L., Weijer K., Hreggvidsdottir H.S., Heinsbroek S.E., Legrand N., Buskens C.J., et al. 2013. Human type 1 innate lymphoid cells accumulate in inflamed mucosal tissues. Nat. Immunol. 14:221–229 10.1038/ni.2534 - DOI - PubMed
    1. Buonocore S., Ahern P.P., Uhlig H.H., Ivanov I.I., Littman D.R., Maloy K.J., Powrie F. 2010. Innate lymphoid cells drive interleukin-23-dependent innate intestinal pathology. Nature. 464:1371–1375 10.1038/nature08949 - DOI - PMC - PubMed

Publication types

MeSH terms