. 2014 Mar;10(3):442-52.
doi: 10.4161/auto.27418. Epub 2014 Jan 3.

MIR34A regulates autophagy and apoptosis by targeting HMGB1 in the retinoblastoma cell

Affiliations

MIR34A regulates autophagy and apoptosis by targeting HMGB1 in the retinoblastoma cell

Ke Liu et al. Autophagy. 2014 Mar.

Abstract

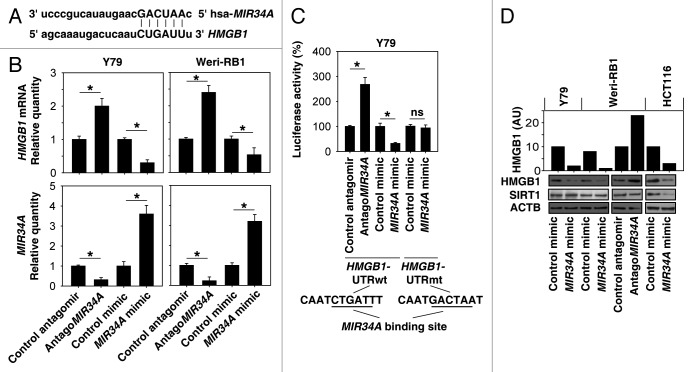
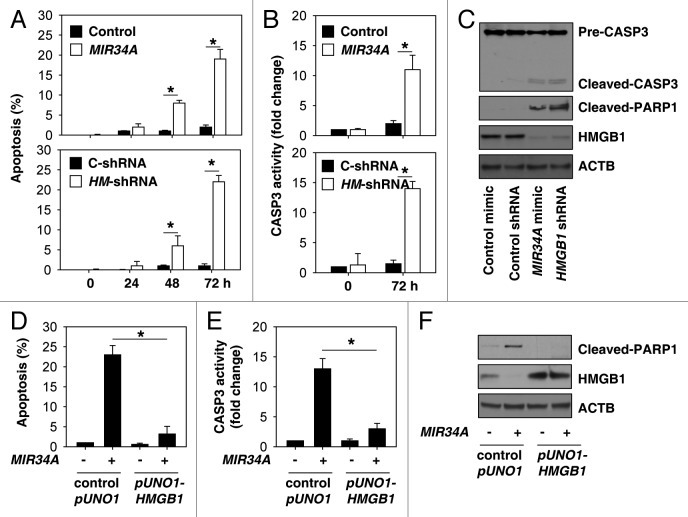
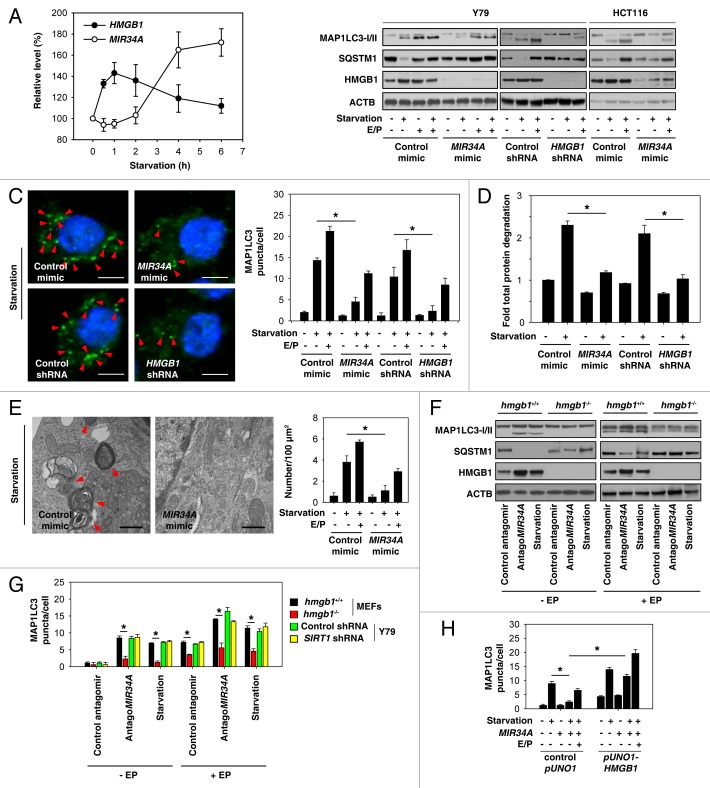
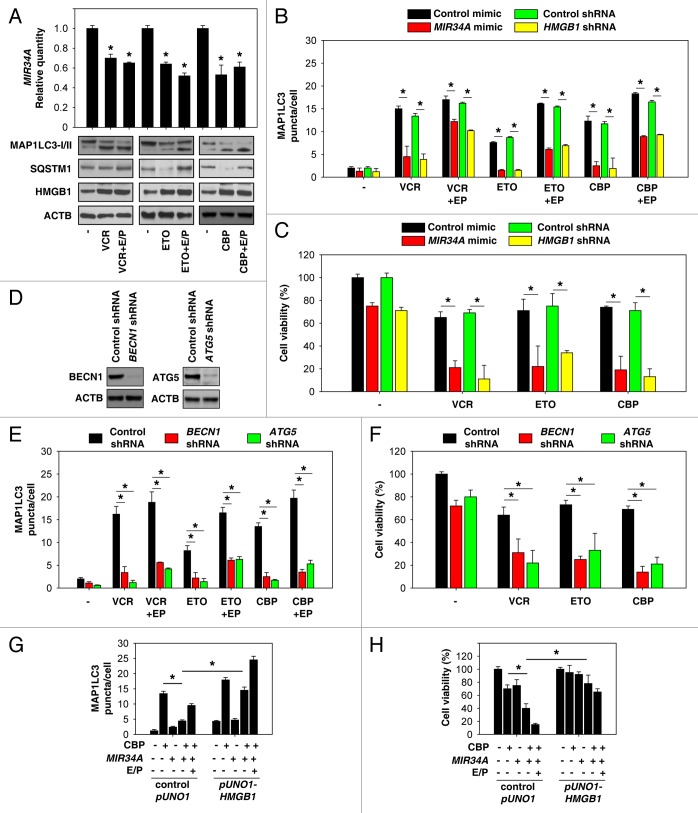
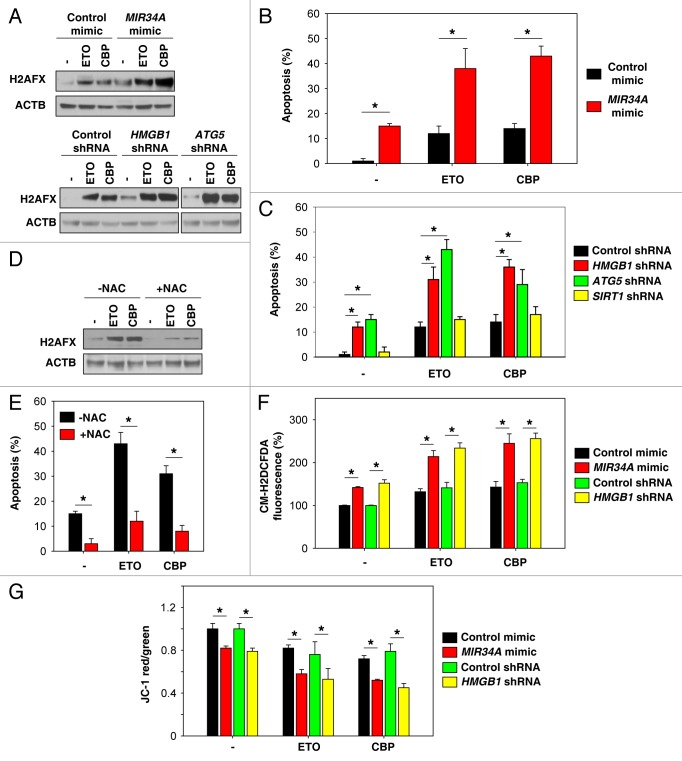
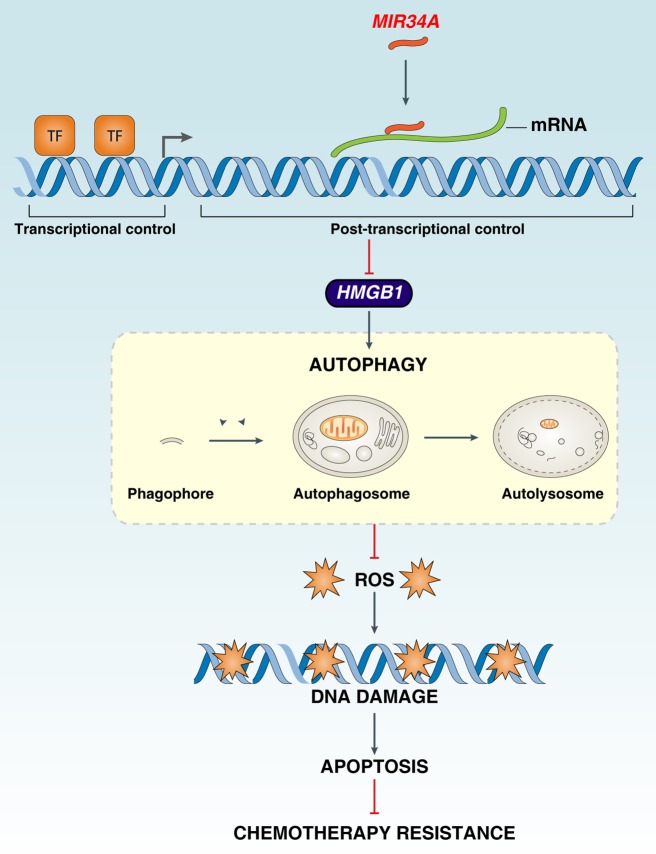
MIR34A (microRNA 34a) is a tumor suppressor gene, but how it regulates chemotherapy response and resistance is not completely understood. Here, we show that the microRNA MIR34A-dependent high mobility group box 1 (HMGB1) downregulation inhibits autophagy and enhances chemotherapy-induced apoptosis in the retinoblastoma cell. HMGB1 is a multifaceted protein with a key role in autophagy, a self-degradative, homeostatic process with a context-specific role in cancer. MIR34A inhibits HMGB1 expression through a direct MIR34A-binding site within the HMGB1 3' untranslated region. MIR34A inhibition of HMGB1 leads to a decrease in autophagy under starvation conditions or chemotherapy treatment. Inhibition of autophagy promotes oxidative injury and DNA damage and increases subsequent CASP3 activity, CASP3 cleavage, and PARP1 [poly (ADP-ribose) polymerase 1] cleavage, which are important to the apoptotic process. Finally, upregulation of MIR34A, knockdown of HMGB1, or inhibition of autophagy (e.g., knockdown of ATG5 and BECN1) restores chemosensitivity and enhances tumor cell death in the retinoblastoma cell. These data provide new insights into the mechanisms governing the regulation of HMGB1 expression by microRNA and their possible contribution to autophagy and drug resistance.

Keywords: Hmbg1; apoptosis; autophagy; chemotherapy; microRNA.


Figures

None
Figure 1.MIR34A targets HMGB1. (A) Schema representing the functional interaction between MIR34A and the seed sequence (bold) in the 3′UTR of HMGB1 as predicted by miRanda-mirSVR (http://www.microrna.org/microrna/home.do). (B) Y79 and Weri-RB1 cells were transfected with antagomir or mimic of MIR34A or nontarget antagomir or mimic control (100 nM) for 72 h, and the level of MIR34A was assayed by TaqMan qRT-PCR. In parallel, the mRNA level of HMGB1 was assayed by qRT-PCR (n = 3, *P < 0.05). Data represent relative level, with control set as 1. (C) Luciferase assay of Y79 cells cotransfected with reporter constructs containing HMGB1 3′ UTRs with (HMGB1-UTRwt) or without (HMGB1-UTRmt) MIR34a-binding sites and mimic of MIR34A or scrambled control miRNA for 72 h (n = 3, *P < 0.05; ns, nonsignificant). Data represent relative level, with control set as 100%. (D) Y79, Weri-RB1 and HCT116 cells were transfected with indicated miRNAs or antagomir RNAs for 72 h, and the level of HMGB1 and SIRT1 protein expression was assayed by western blot. AU = arbitrary unit.
None
Figure 2.MIR34A induces apoptosis through suppression of HMGB1 expression. (A and B) Y79 cells were transfected with mimic of MIR34A, non-target mimic control, HMGB1 shRNA (HM-shRNA), or control shRNA (C-shRNA) for 0 to 72 h, and then apoptosis (A) was analyzed by measuring ANXA5-positive cells by flow cytometry and CASP3 activity (B) was measured with the CASP3 Colorimetric Assay Kit (n = 3, *P < 0.05). (C) In parallel, the indicated protein level was assayed by western blot. (D and E) Y79 cells were transfected with mimic of MIR34A, control pUNO1 cDNA, or pUNO1-HMGB1 cDNA for 72 h, and then apoptosis (D) was analyzed by measuring ANXA5-positive cells by flow cytometry and CASP3 activity (E) was measured by CASP3 Colorimetric Assay Kit (n = 3, *P < 0.05). (F) In parallel, the indicated protein level was assayed by western blot.
None
Figure 3.MIR34A inhibits autophagy through modification of HMGB1 expression. (A) Y79 cells were incubated in HBSS for different lengths of time (0 to 6 h); the relative expression levels of HMGB1 mRNA and MIR34A were assessed by qRT-PCR and TaqManqRT-PCR, respectively, with control set as 100%. (B) Y79 and HCT116 were transfected with mimic of MIR34A, mimic control, HMGB1 shRNA, or control shRNA for 72 h, and then treated with HBSS with or without E64D/ pepstatin A (E/P, 10 μg/ml) for 1 h. The levels of MAP1LC3-I/II, SQSTM1, and HMGB1 protein expression were assayed by western blot. (C–E) In parallel, the MAP1LC3 puncta formation (C, shown by red arrow), the long-lived protein degradation and ultrastructural features of autophagic vacuoles (E, shown by red arrow) was assayed as described in Materials and Methods (*P < 0.05). (F and G) Hmgb1+/+ and hmgb1−/− MEFs or SIRT1 knockdown Y79 cells were transfected with antagoMIR34A or nontarget antagomir for 72 h or treated with HBSS in the presence and absence of E64D/pepstatin A (E/P, 10 μg/ml) for 1 h, the levels of MAP1LC3-I/II, SQSTM1, and HMGB1 protein expression were assayed by western blot (F), and MAP1LC3 puncta formation was assayed by confocal microscopic analysis (G). *P < 0.05. (H) Y79 cells were transfected with mimic of MIR34A, control pUNO1 cDNA, or pUNO1-HMGB1 cDNA for 72 h, and then treated with HBSS in the presence and absence of E64D/pepstatin A (E/P, 10 μg/ml) for 1 h; MAP1LC3 puncta formation was assayed by confocal microscopic analysis. *P < 0.05.
None
Figure 4. Inhibition of autophagy enhances chemotherapeutic efficacy in retinoblastoma cells. (A) Y79 cells were treated with vincristine (VCR, 2.5 nM), etoposide (ETO, 1 µM), and carboplatin (CBP, 1 µM) in the presence and absence of E64D/pepstatin A (E/P, 10 μg/ml) for 48 h, and the levels of MAP1LC3-I/II and HMGB1 were assayed by western blot. In parallel, the level of MIR34A was assayed by TaqMan qRT-PCR (n = 3, *P < 0.05, VS. control group). Data represent relative level, with control set as 1. (B and C) Y79 were transfected with mimic of MIR34A, mimic control, HMGB1 shRNA, or control shRNA for 72 h, and then treated with VCR (2.5 nM), ETO (1 µM), and CBP (1 µM) in the presence and absence of E64D/pepstatin A (E/P, 10 μg/ml) for 48 h. The MAP1LC3 puncta formation (B) was assayed by confocal microscopic analysis and cell viability (C) was assayed by CCK-8 kit (*P < 0.05). (D) Western blot analysis of BECN1 and ATG5 expression in Y79 cells after transfection with indicated shRNA. (E and F) Y79 cells were transfected with BECN1 shRNA, ATG5 shRNA, or control shRNA for 72 h, and then treated with VCR (2.5 nM), ETO (1 µM), and CBP (1 µM) for 48 h. MAP1LC3 puncta formation (E) was assayed by confocal microscopic analysis and cell viability (F) was assayed by CCK-8 kit (*P < 0.05). (G) Y79 cells were transfected with mimic of MIR34A, control pUNO1 cDNA, or pUNO1-HMGB1 cDNA for 72 h, and then treated with carboplatin (CBP, 1 µM) in the presence and absence of E64D/pepstatin A (E/P, 10 μg/ml) for 48 h, and MAP1LC3 puncta formation was assayed by confocal microscopic analysis (*P < 0.05). (H) In parallel, cell viability was assayed by CCK-8 kit (n = 3, *P < 0.05).
None
Figure 5. Inhibition of autophagy enhances DNA damage in chemotherapy. (A) Indicated Y79 cells were treated with etoposide (ETO, 1 µM) and carboplatin (CBP, 1 µM) for 48 h, and the level of gamma-H2AFX was assayed by western blot. (B and C) In parallel, apoptosis was analyzed by measuring ANXA5-positive cells (n = 3, *P < 0.05). (D) ATG5 knockdown Y79 cells were treated with ETO (1 µM) and CBP (1 µM) with or without antioxidant NAC (50 mM) for 48 h, and the level of gamma-H2AFX was assayed by western blot. (E) In parallel, apoptosis was analyzed by measuring ANXA5-positive cells (n = 3, *P < 0.05). (F and G) Indicated Y79 cells were treated with ETO (1 µM) and CBP (1 µM) for 48 h. ROS production (F) was assessed by measuring the fluorescent intensity of CM-H2DCFDA in a fluorescent plate reader, and mitochondrial membrane potential depolarization (G) was measured by JC-1 fluorescence (n = 3, *P < 0.05).
None
Figure 6.MIR34A regulates autophagy and apoptosis by targeting HMGB1. HMGB1 is a direct transcriptional target of MIR34A. MIR34A inhibition of HMGB1 leads to a decrease in autophagy that promotes oxidative injury, DNA damage, and subsequent apoptosis during chemotherapy.

Similar articles

Cited by

References

    1. Bartel DP. MicroRNAs: genomics, biogenesis, mechanism, and function. Cell. 2004;116:281–97. doi: 10.1016/S0092-8674(04)00045-5. - DOI - PubMed
    1. Calin GA, Croce CM. MicroRNA signatures in human cancers. Nat Rev Cancer. 2006;6:857–66. doi: 10.1038/nrc1997. - DOI - PubMed
    1. Garzon R, Calin GA, Croce CM. MicroRNAs in Cancer. Annu Rev Med. 2009;60:167–79. doi: 10.1146/annurev.med.59.053006.104707. - DOI - PubMed
    1. Dimaras H, Kimani K, Dimba EA, Gronsdahl P, White A, Chan HS, Gallie BL. Retinoblastoma. Lancet. 2012;379:1436–46. doi: 10.1016/S0140-6736(11)61137-9. - DOI - PubMed
    1. Jo DH, Kim JH, Park WY, Kim KW, Yu YS, Kim JH. Differential profiles of microRNAs in retinoblastoma cell lines of different proliferation and adherence patterns. J Pediatr Hematol Oncol. 2011;33:529–33. doi: 10.1097/MPH.0b013e318228280a. - DOI - PubMed

Publication types

LinkOut - more resources