

Aerobic glycolysis in the human brain is associated with development and neotenous gene expression
- PMID: 24411938
- PMCID: PMC4389678
- DOI: 10.1016/j.cmet.2013.11.020
Aerobic glycolysis in the human brain is associated with development and neotenous gene expression
Abstract
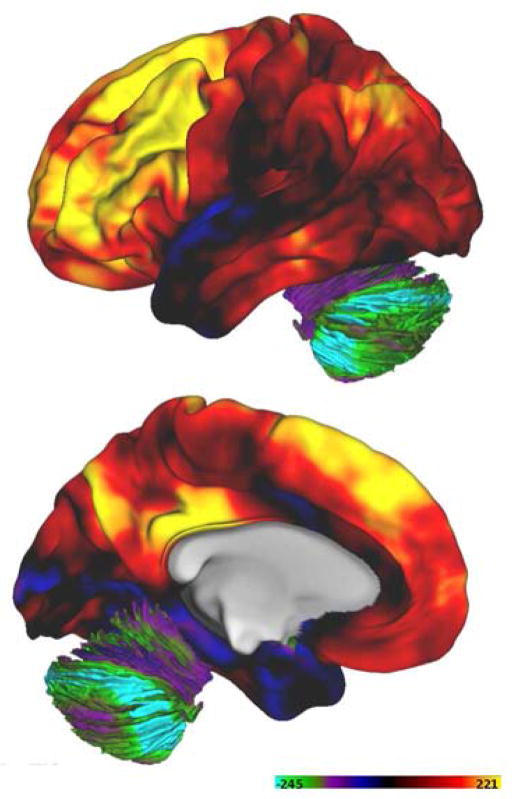
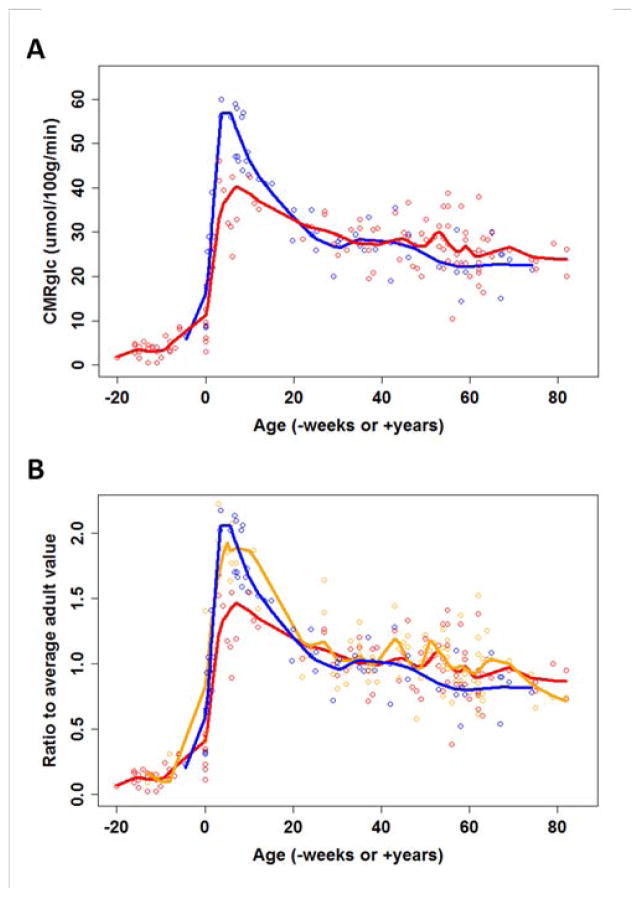
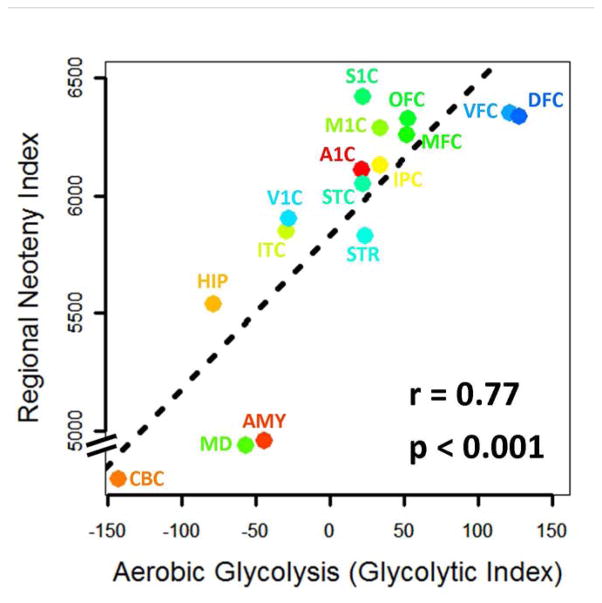
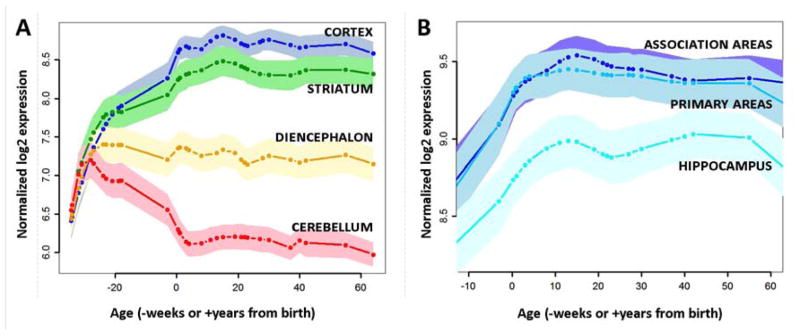
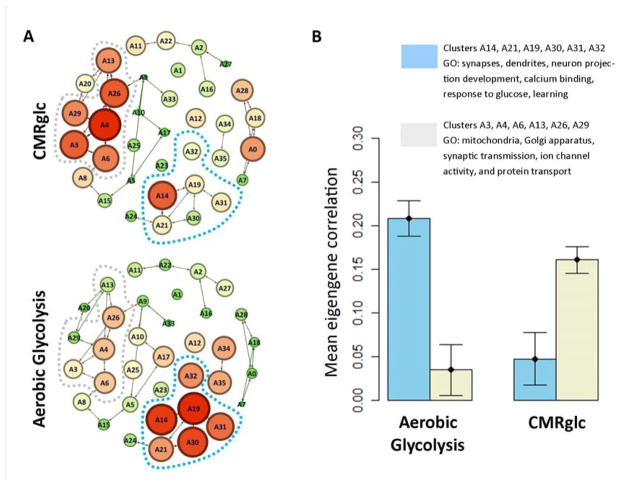
Aerobic glycolysis (AG; i.e., nonoxidative metabolism of glucose despite the presence of abundant oxygen) accounts for 10%-12% of glucose used by the adult human brain. AG varies regionally in the resting state. Brain AG may support synaptic growth and remodeling; however, data supporting this hypothesis are sparse. Here, we report on investigations on the role of AG in the human brain. Meta-analysis of prior brain glucose and oxygen metabolism studies demonstrates that AG increases during childhood, precisely when synaptic growth rates are highest. In resting adult humans, AG correlates with the persistence of gene expression typical of infancy (transcriptional neoteny). In brain regions with the highest AG, we find increased gene expression related to synapse formation and growth. In contrast, regions high in oxidative glucose metabolism express genes related to mitochondria and synaptic transmission. Our results suggest that brain AG supports developmental processes, particularly those required for synapse formation and growth.
Copyright © 2014 Elsevier Inc. All rights reserved.
Figures
Comment in
-
Synaptic plasticity and the Warburg effect.Cell Metab. 2014 Jan 7;19(1):4-5. doi: 10.1016/j.cmet.2013.12.012. Cell Metab. 2014. PMID: 24411936
Similar articles
-
Brain aerobic glycolysis and motor adaptation learning.Proc Natl Acad Sci U S A. 2016 Jun 28;113(26):E3782-91. doi: 10.1073/pnas.1604977113. Epub 2016 May 23. Proc Natl Acad Sci U S A. 2016. PMID: 27217563 Free PMC article.
-
Aerobic glycolysis and tau deposition in preclinical Alzheimer's disease.Neurobiol Aging. 2018 Jul;67:95-98. doi: 10.1016/j.neurobiolaging.2018.03.014. Epub 2018 Mar 20. Neurobiol Aging. 2018. PMID: 29655050 Free PMC article.
-
Loss of Brain Aerobic Glycolysis in Normal Human Aging.Cell Metab. 2017 Aug 1;26(2):353-360.e3. doi: 10.1016/j.cmet.2017.07.010. Cell Metab. 2017. PMID: 28768174 Free PMC article.
-
Aerobic glycolysis in the primate brain: reconsidering the implications for growth and maintenance.Brain Struct Funct. 2014 Jul;219(4):1149-67. doi: 10.1007/s00429-013-0662-z. Epub 2013 Nov 2. Brain Struct Funct. 2014. PMID: 24185460 Review.
-
Cellular mechanisms of brain energy metabolism and their relevance to functional brain imaging.Philos Trans R Soc Lond B Biol Sci. 1999 Jul 29;354(1387):1155-63. doi: 10.1098/rstb.1999.0471. Philos Trans R Soc Lond B Biol Sci. 1999. PMID: 10466143 Free PMC article. Review.
Cited by
-
Dependence of hippocampal function on ERRγ-regulated mitochondrial metabolism.Cell Metab. 2015 Apr 7;21(4):628-36. doi: 10.1016/j.cmet.2015.03.004. Cell Metab. 2015. PMID: 25863252 Free PMC article.
-
Glucose, lactate, and shuttling of metabolites in vertebrate retinas.J Neurosci Res. 2015 Jul;93(7):1079-92. doi: 10.1002/jnr.23583. Epub 2015 Mar 20. J Neurosci Res. 2015. PMID: 25801286 Free PMC article. Review.
-
Persistent changes in extracellular lactate dynamics following synaptic potentiation.Neurobiol Learn Mem. 2020 Nov;175:107314. doi: 10.1016/j.nlm.2020.107314. Epub 2020 Sep 20. Neurobiol Learn Mem. 2020. PMID: 32961277 Free PMC article.
-
Human neuronal maturation comes of age: cellular mechanisms and species differences.Nat Rev Neurosci. 2024 Jan;25(1):7-29. doi: 10.1038/s41583-023-00760-3. Epub 2023 Nov 23. Nat Rev Neurosci. 2024. PMID: 37996703 Review.
-
Sulfotransferase 4A1 activity facilitates sulfate-dependent cellular protection to oxidative stress.Sci Rep. 2022 Jan 31;12(1):1625. doi: 10.1038/s41598-022-05582-4. Sci Rep. 2022. PMID: 35102205 Free PMC article.
References
-
- ABHA Allen Brain Human Atlas [Internet] Seattle (WA): Allen Institute for Brain Science; ©2009. Available from: http://www.brain-map.org.
-
- Altman DI, Perlman JM, Volpe JJ, Powers WJ. Cerebral oxygen metabolism in newborns. Pediatrics. 1993;92:99–104. - PubMed
-
- Attwell D, Laughlin SB. An energy budget for signaling in the grey matter of the brain. J Cereb Blood Flow Metab. 2001;21:1133–1145. - PubMed
-
- Barros LF. Metabolic signaling by lactate in the brain. Trends in neurosciences. 2013;36:396–404. - PubMed
Publication types
MeSH terms
Substances
Grants and funding
LinkOut - more resources
Full Text Sources
Other Literature Sources
