A biochemical landscape of A-to-I RNA editing in the human brain transcriptome
- PMID: 24407955
- PMCID: PMC3941116
- DOI: 10.1101/gr.162537.113
A biochemical landscape of A-to-I RNA editing in the human brain transcriptome
Abstract
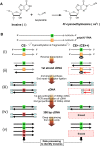
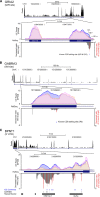
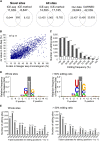
Inosine is an abundant RNA modification in the human transcriptome and is essential for many biological processes in modulating gene expression at the post-transcriptional level. Adenosine deaminases acting on RNA (ADARs) catalyze the hydrolytic deamination of adenosines to inosines (A-to-I editing) in double-stranded regions. We previously established a biochemical method called "inosine chemical erasing" (ICE) to directly identify inosines on RNA strands with high reliability. Here, we have applied the ICE method combined with deep sequencing (ICE-seq) to conduct an unbiased genome-wide screening of A-to-I editing sites in the transcriptome of human adult brain. Taken together with the sites identified by the conventional ICE method, we mapped 19,791 novel sites and newly found 1258 edited mRNAs, including 66 novel sites in coding regions, 41 of which cause altered amino acid assignment. ICE-seq detected novel editing sites in various repeat elements as well as in short hairpins. Gene ontology analysis revealed that these edited mRNAs are associated with transcription, energy metabolism, and neurological disorders, providing new insights into various aspects of human brain functions.
Figures


Similar articles
-
Biochemical and Transcriptome-Wide Identification of A-to-I RNA Editing Sites by ICE-Seq.Methods Enzymol. 2015;560:331-53. doi: 10.1016/bs.mie.2015.03.014. Epub 2015 Jul 9. Methods Enzymol. 2015. PMID: 26253977
-
Discovering A-to-I RNA Editing Through Chemical Methodology "ICE-seq".Methods Mol Biol. 2021;2181:113-148. doi: 10.1007/978-1-0716-0787-9_8. Methods Mol Biol. 2021. PMID: 32729078
-
Transcriptome-wide identification of adenosine-to-inosine editing using the ICE-seq method.Nat Protoc. 2015 May;10(5):715-32. doi: 10.1038/nprot.2015.037. Epub 2015 Apr 9. Nat Protoc. 2015. PMID: 25855956
-
Significance of A-to-I RNA editing of transcripts modulating pharmacokinetics and pharmacodynamics.Pharmacol Ther. 2018 Jan;181:13-21. doi: 10.1016/j.pharmthera.2017.07.003. Epub 2017 Jul 15. Pharmacol Ther. 2018. PMID: 28716651 Review.
-
Proteome diversification by adenosine to inosine RNA editing.RNA Biol. 2010 Mar-Apr;7(2):205-12. doi: 10.4161/rna.7.2.11286. Epub 2010 Mar 25. RNA Biol. 2010. PMID: 20200492 Review.
Cited by
-
Deciphering Epitranscriptome: Modification of mRNA Bases Provides a New Perspective for Post-transcriptional Regulation of Gene Expression.Front Cell Dev Biol. 2021 Mar 16;9:628415. doi: 10.3389/fcell.2021.628415. eCollection 2021. Front Cell Dev Biol. 2021. PMID: 33816473 Free PMC article. Review.
-
RNA Modification Detection Using Nanopore Direct RNA Sequencing and nanoDoc2.Methods Mol Biol. 2023;2632:299-319. doi: 10.1007/978-1-0716-2996-3_21. Methods Mol Biol. 2023. PMID: 36781737
-
RNAME: A comprehensive database of RNA modification enzymes.Comput Struct Biotechnol J. 2022 Nov 11;20:6244-6249. doi: 10.1016/j.csbj.2022.11.022. eCollection 2022. Comput Struct Biotechnol J. 2022. PMID: 36420165 Free PMC article.
-
Building an RNA Sequencing Transcriptome of the Central Nervous System.Neuroscientist. 2016 Dec;22(6):579-592. doi: 10.1177/1073858415610541. Epub 2015 Oct 13. Neuroscientist. 2016. PMID: 26463470 Free PMC article. Review.
-
PROBer Provides a General Toolkit for Analyzing Sequencing-Based Toeprinting Assays.Cell Syst. 2017 May 24;4(5):568-574.e7. doi: 10.1016/j.cels.2017.04.007. Epub 2017 May 10. Cell Syst. 2017. PMID: 28501650 Free PMC article.
References
Publication types
MeSH terms
Substances
LinkOut - more resources
Full Text Sources
Other Literature Sources
