. 2014;13(5):820-33.
doi: 10.4161/cc.27728. Epub 2014 Jan 9.

Inhibition of GSK-3β activity can result in drug and hormonal resistance and alter sensitivity to targeted therapy in MCF-7 breast cancer cells

Affiliations

Inhibition of GSK-3β activity can result in drug and hormonal resistance and alter sensitivity to targeted therapy in MCF-7 breast cancer cells

Melissa Sokolosky et al. Cell Cycle. 2014.

Abstract

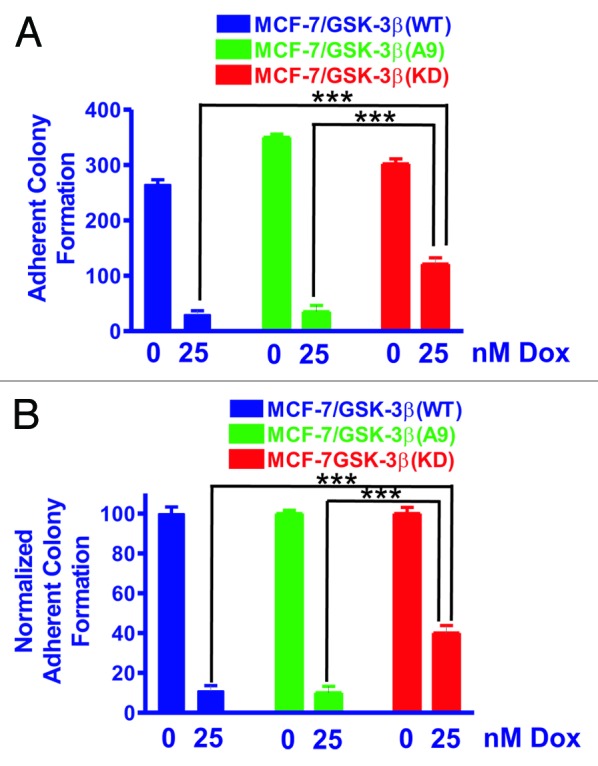
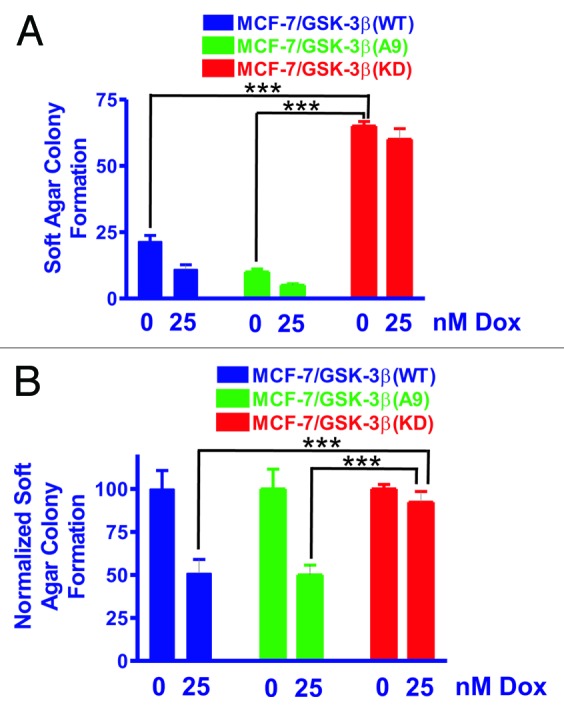
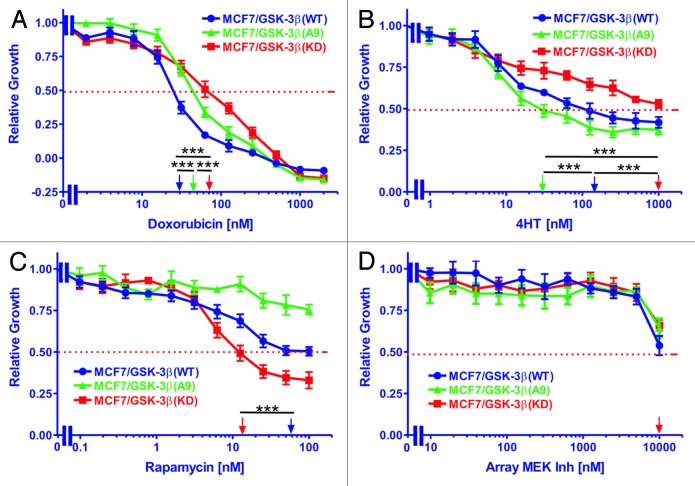
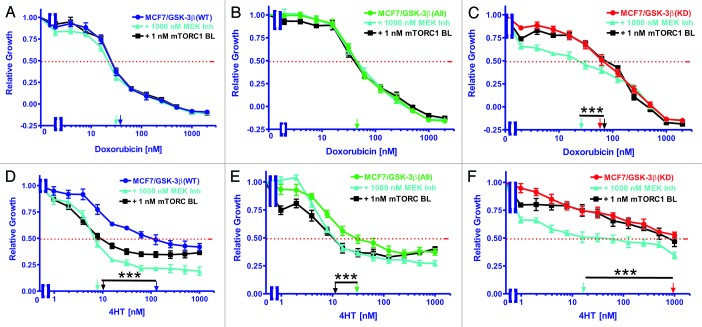
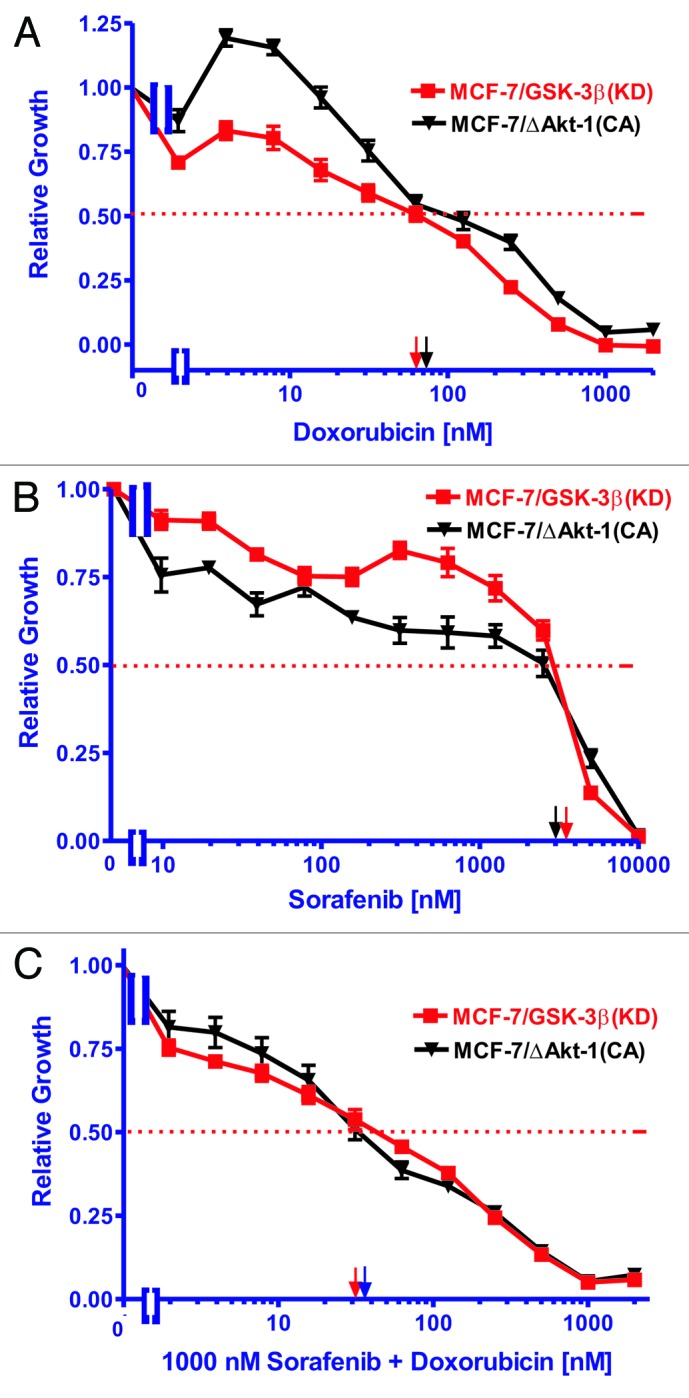
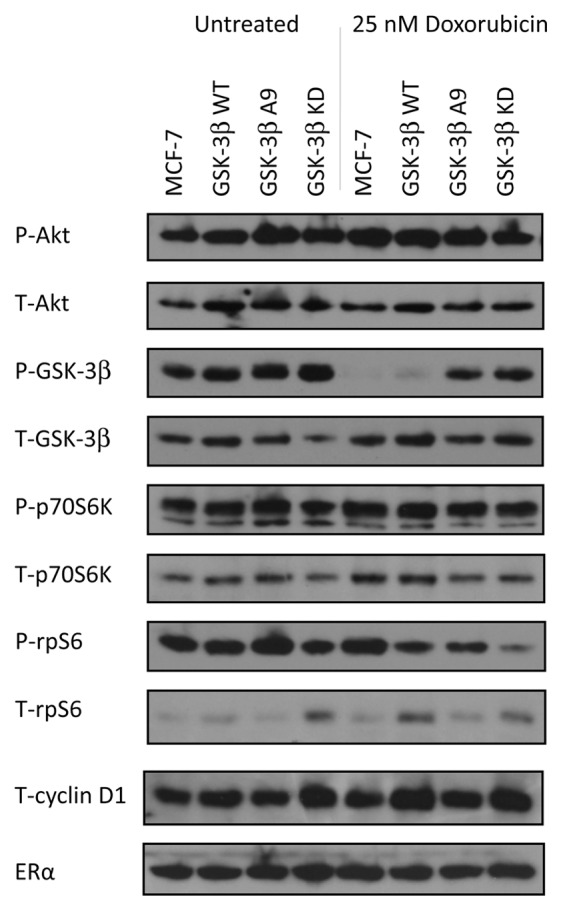
The PI3K/Akt/mTORC1 pathway plays prominent roles in malignant transformation, prevention of apoptosis, drug resistance, and metastasis. One molecule regulated by this pathway is GSK-3β. GSK-3β is phosphorylated by Akt on S9, which leads to its inactivation; however, GSK-3β also can regulate the activity of the PI3K/Akt/mTORC1 pathway by phosphorylating molecules such as PTEN, TSC2, p70S6K, and 4E-BP1. To further elucidate the roles of GSK-3β in chemotherapeutic drug and hormonal resistance of MCF-7 breast cancer cells, we transfected MCF-7 breast cancer cells with wild-type (WT), kinase-dead (KD), and constitutively activated (A9) forms of GSK-3β. MCF-7/GSK-3β(KD) cells were more resistant to doxorubicin and tamoxifen compared with either MCF-7/GSK-3β(WT) or MCF-7/GSK-3β(A9) cells. In the presence and absence of doxorubicin, the MCF-7/GSK-3β(KD) cells formed more colonies in soft agar compared with MCF-7/GSK-3β(WT) or MCF-7/GSK-3β(A9) cells. In contrast, MCF-7/GSK-3β(KD) cells displayed an elevated sensitivity to the mTORC1 blocker rapamycin compared with MCF-7/GSK-3β(WT) or MCF-7/GSK-3β(A9) cells, while no differences between the 3 cell types were observed upon treatment with a MEK inhibitor by itself. However, resistance to doxorubicin and tamoxifen were alleviated in MCF-7/GSK-3β(KD) cells upon co-treatment with an MEK inhibitor, indicating regulation of this resistance by the Raf/MEK/ERK pathway. Treatment of MCF-7 and MCF-7/GSK-3β(WT) cells with doxorubicin eliminated the detection of S9-phosphorylated GSK-3β, while total GSK-3β was still detected. In contrast, S9-phosphorylated GSK-3β was still detected in MCF-7/GSK-3β(KD) and MCF-7/GSK-3β(A9) cells, indicating that one of the effects of doxorubicin on MCF-7 cells was suppression of S9-phosphorylated GSK-3β, which could result in increased GSK-3β activity. Taken together, these results demonstrate that introduction of GSK-3β(KD) into MCF-7 breast cancer cells promotes resistance to doxorubicin and tamoxifen, but sensitizes the cells to mTORC1 blockade by rapamycin. Therefore GSK-3β is a key regulatory molecule in sensitivity of breast cancer cells to chemo-, hormonal, and targeted therapy.

Keywords: GSK-3β; MEK; PI3K; mTOR; rapamycin; sorafenib; targeted therapy; therapy resistance; β-catenin.


Figures

None
Figure 1. MCF-7/GSK-3β(KD) cells form more colonies under adherence conditions in the presence of doxorubicin than either MCF-7/GSK-3β(WT) or MCF-7/GSK-3β(A9) cells. The abilities of MCF-7/GSK-3β(WT), MCF-7/GSK-3β(A9), and MCF-7/GSK-3β(KD) cells to form colonies in the presence and absence of 25 nM doxorubicin were determined by plating the cells in triplicate in 6-well plates under adherence conditions. (A) Mean and standard deviation of raw colony counts. The P value between the subcloning of MCF-7/GSK-3β(WT) and MCF-7/GSK-3β(A9) in the absence of doxorubicin was 0.0012. The P value between the subcloning of MCF-7/GSK-3β(WT) and MCF-7/GSK-3β(KD) in the absence of doxorubicin was 0.0432. The P value between the subcloning of MCF-7/GSK-3β(A9) and MCF-7/GSK3β(KD) in the absence of doxorubicin was 0.0116. The P value between the subcloning of MCF-7/GSK-3β(WT) and MCF-7/GSK-3β(A9) in the presence of doxorubicin was 0.7292 and was not significantly different. The P value between the subcloning of MCF-7/GSK-3β(WT) and MCF-7/GSK-3β(KD) in the presence of doxorubicin was 0.0025. The P value between the subcloning of MCF-7/GSK-3β(A9) and MCF-7/GSK-3β(KD) in the presence of doxorubicin was 0.0062. (B) Mean and standard deviations of normalized cell counts. In this panel the mean of the raw counts for each cell type was set (normalized) to 100 and the mean and standard deviation of the raw counts in the presence of 25 nM doxorubicin was normalized to the number of counts in the untreated condition for each cell type. This normalized graph eliminates differences in plating efficiency between the 3 cell types in the absence of doxorubicin. The P value between the subcloning of MCF-7/GSK-3β(WT) and MCF-7/GSK-3β(KD) in the presence of doxorubicin was 0.0033. The P value between the subcloning of MCF-7/GSK-3β(A9) and MCF-7/GSK-3β(KD) in the presence of doxorubicin was 0.0040.
None
Figure 2. MCF-7/GSK-3β(KD) cells form more colonies in soft agar in the presence or absence of doxorubicin than either MCF-7/GSK-3β(WT) or MCF-7/GSK-3β(A9) cells. The ability of MCF-7/GSK-3β(WT), MCF-7/GSK-3β(A9), and MCF-7/GSK-3β(KD) cells to form colonies in the presence and absence of 25 nM doxorubicin was determined by plating the cells in triplicate in 6-well plates in soft agar conditions which measures the ability of the cells to grow in an anchorage-independent fashion., (A) Mean and standard deviation of raw colony counts in soft agar. The statistical significance of the number of colonies in the absence of 25 nM doxorubicin for MCF-7/GSK-3β(KD) cells was compared with MCF-7/GSK-3β(WT) and MCF-7/GSK-3β(A9) cells by the unpaired t test with a 95% confidence interval. Comparisons determined to be statistically significant are indicated by ***. In addition, the colony formation of MCF-7/GSK-3β(KD) in the presence of 25 nM doxorubicin was higher than that observed in MCF-7/GSK-3β(WT) and MCF-7/GSK-3β(A9) cells and was determined to be statically significant by the unpaired t test with a 95% confidence interval. The P value between the subcloning of MCF-7/GSK-3β(WT) and MCF-7/GSK-3β(A9) in soft agar in the absence of doxorubicin was 0.0131. The P value between the subcloning of MCF-7/GSK-3β(WT) and MCF-7/GSK-3β(KD) in soft agar in the absence of doxorubicin was 0.0001. The P value between the subcloning of MCF-7/GSK-3β(A9) and MCF-7/GSK-3β(KD) in soft agar in the absence of doxorubicin was 0.0001. The P value between the subcloning of MCF-7/GSK-3β(WT) and MCF-7/GSK3β(A9) in soft agar in the presence of doxorubicin was 0.0303. The P value between the subcloning of MCF-7/GSK-3β(WT) and MCF-7/GSK-3(KD) in soft agar in the presence of doxorubicin was 0.0004. The P value between the subcloning of MCF-7/GSK-3β(A9) and MCF-7/GSK-3β(KD) in soft agar in the presence of doxorubicin was 0.0002. (B) Mean and standard deviations of normalized cell colonies in soft agar. In this panel the mean of the raw counts for each cell type was set (normalized) to 100 and the mean and standard deviation of the raw counts in the presence of 25 nM doxorubicin was normalized to the number of counts in the untreated condition for each cell type. This normalized graph eliminates differences in plating efficiency between the 3 cell types in the absence of doxorubicin. Comparisons determined to be statistically significant are indicated by ***. The P value between the subcloning of MCF-7/GSK-3β(WT) and MCF-7/GSK-3β(KD) in soft agar in the presence of doxorubicin was 0.0155. The P value between the subcloning of MCF-7/GSK-3β(A9) and MCF-7/GSK3β(KD) in soft agar the presence of doxorubicin was 0.0076.
None
Figure 3. Effects of GSK-3β expression on sensitivity to doxorubicin, tamoxifen, a mTORC1 blocker and a MEK inhibitor. The effects of GSK-3β(WT), GSK-3β(A9) and GSK-3β(KD) on the sensitivity of MCF-7 cells to: (A) doxorubicin, (B) tamoxifen (4HT), (C) rapamycin, and (D) Array MEK Inhibitor (ARRY 509) were examined by MTT analysis after incubation of the cells in the indicated concentrations of the drugs. The arrows represents where 50% inhibition of growth intercepts with the x-axis and is used to estimate the IC50. The statistical significance was determined by the unpaired t test. Comparisons determined to be significant are indicated with (***). Symbols: MCF-7/GSK-3β(WT), dark blue lines with solid circles, MCF-7/GSK-3β(A9), green lines with solid triangles, MCF-7/GSK-3β(KD), red lines with solid squares. (A) The P value between doxorubicin treatment of MCF-7/GSK-3β(WT) and MCF-7/GSK-3β(A9) was 0.0001. The P value between doxorubicin treatment of MCF-7/GSK-3β(WT) and MCF-7/GSK-3β(KD) was 0.0001. The P value between doxorubicin treatment of MCF-7/GSK-3β(A9) and MCF-7/GSK-3β(KD) was 0.0001. (B) The P value between 4HT treatment of MCF-7/GSK-3β(WT) and MCF-7/GSK3β(A9) was 0.0001. The P value between 4HT treatment of MCF-7/GSK-3β(WT) and MCF-7/GSK-3β(KD) was 0.0001. The P value between 4HT treatment of MCF-7/GSK-3β(A9) and MCF-7/GSK-3β(KD) was 0.0001. (C) The P value between rapamycin treatment of MCF-7/GSK-3β(WT) and MCF-7/GSK-3β(KD) was 0.0001.
None
Figure 4. Effects of co-treatment with doxorubicin, 4HT and either a mTORC1 blocker or a MEK inhibitor on drug sensitivity. The effects of a mTORC blocker or a MEK inhibitor on the sensitivity of MCF-7/GSK-3β(WT), MCF-7/GSK-3β(A9), or MCF-7/GSK-3β(KD) cells to doxorubicin or 4HT were examined by MTT analysis after incubation of the cells in the indicated concentrations of the drugs. Symbols: (A and D) MCF-7/GSK-3β(WT), dark blue lines with solid circles, MCF-7/GSK-3β(WT) with 1000 nM MEK inhibitor in light blue lines with upward triangles, MCF-7/GSK-3β(WT) with 1000 1nM mTORC1 inhibitor in black lines with squares. (B and E) MCF-7/GSK-3β(A9), green lines with solid triangles, MCF-7/GSK-3β(A9) with 1000 nM MEK inhibitor in light blue lines with upward triangles, MCF-7/GSK-3β(A9) with 1000 1nM mTORC1 inhibitor in black lines with squares. (C and F) MCF-7/GSK-3β(KD), red lines with solid squares. MCF-7/GSK-3β(KD) with 1000 nM MEK inhibitor in light blue lines with upward triangles, MCF-7/GSK-3β(KD) with 1000 1nM mTORC1 inhibitor in black lines with squares. The arrows represents where 50% inhibition of growth intercepts with the x-axis and is used to estimate the IC50. The single treatment for each cell line are the same as those presented in Figure 3, as all the experiments in Figures 2 and 4 were performed over the same time period, together. The effects of adding a constant dose of either 1 nM mTORC1 blocker (mTORC BL = rapamycin) or 1000 nM MEK inhibitor (ARRY 509) on the doxorubicin IC50s were examined in (A) MCF-7/GSK-3β(WT), (B) MCF-7/GSK-3β(A9), and (C) MCF-7/GSK-3β(KD) cells. (D, E, and F) The effects of adding a constant dose of either 1 nM mTORC1 blocker (mTORC BL = rapamycin) or 1000 nM MEK inhibitor (ARRY 509) on the 4HT IC50s were examined in (D) MCF-7/GSK-3β(WT), (E) MCF-7/GSK-3β(A9), and (F) MCF-7/GSK-3β(KD) cells. The statistical significance was determined by the unpaired t test. Comparisons determined to be significant are indicated with (***). The P value between the difference between doxorubicin and doxorubicin and MEK inhibitor treated MCF-7/GSK-3β(KD) cells (C) was less than 0.0001. The P value between the difference between 4HT and 4HT and either MEK inhibitor or rapamycin treated MCF-7/GSK-3β(WT) cells (D) was less than 0.0001. The P value between the difference between 4HT and 4HT and either MEK inhibitor or rapamycin treated MCF-7/GSK-3β(A9) cells (E) was less than 0.0001. The P value between the difference between 4HT and 4HT and MEK inhibitor treated MCF-7/GSK-3β(KD) cells (F) was less than 0.0001.
None
Figure 5. Ability of Sorafenib to reduce the resistance of MCF-7/GSK-3β(KD) and MCF-7/ΔAkt-1(CA) cells to doxorubicin. (A) Doxorubicin, (B) sorafenib, (C) doxorubicin and 1000 nM sorafenib. The effect of doxorubicin, sorafenib or the combination of doxorubicin plus 1000 nM sorafenib were examined by MTT analysis after incubation of the cells in the indicated concentrations of the drugs. The dotted arrow represents where 50% inhibition of growth intercepts with the x-axis and is used to estimate the IC50. Symbols: MCF-7/GSK-3Δ(KD), red squares with red lines, MCF-7/ΔAkt(CA), black upside down triangles with black lines.
None
Figure 6. Western blot analysis of PI3K/Akt/GSK-3β and downstream signaling components in cells cultured in the absence and presence of doxorubicin. MCF-7, MCF-7/GSK-3β(WT), MCF-7/GSK-3β(A9), and MCF-7/GSK-3β(KD) cells were cultured for 24 h either in the absence or presence of 25 nM doxorubicin and then the cells were lysed and protein lysates prepared. Proteins were electrophoresed and western blots prepared and probed with the various antibodies. Bands were normalized to the untreated control (MCF-7) through densitometry with ImageJ software (obtained through the National Institutes of Health).

Comment in

Similar articles

Cited by

References

    1. Embi N, Rylatt DB, Cohen P. Glycogen synthase kinase-3 from rabbit skeletal muscle. Separation from cyclic-AMP-dependent protein kinase and phosphorylase kinase. Eur J Biochem. 1980;107:519–27. doi: 10.1111/j.1432-1033.1980.tb06059.x. - DOI - PubMed
    1. Woodgett JR. Molecular cloning and expression of glycogen synthase kinase-3/factor A. EMBO J. 1990;9:2431–8. - PMC - PubMed
    1. Fang X, Yu SX, Lu Y, Bast RC, Jr., Woodgett JR, Mills GB. Phosphorylation and inactivation of glycogen synthase kinase 3 by protein kinase A. Proc Natl Acad Sci U S A. 2000;97:11960–5. doi: 10.1073/pnas.220413597. - DOI - PMC - PubMed
    1. Cross DA, Alessi DR, Cohen P, Andjelkovich M, Hemmings BA. Inhibition of glycogen synthase kinase-3 by insulin mediated by protein kinase B. Nature. 1995;378:785–9. doi: 10.1038/378785a0. - DOI - PubMed
    1. Stambolic V, Woodgett JR. Mitogen inactivation of glycogen synthase kinase-3 beta in intact cells via serine 9 phosphorylation. Biochem J. 1994;303:701–4. - PMC - PubMed

MeSH terms