. 2014 Mar;24(3):390-400.
doi: 10.1101/gr.163519.113. Epub 2014 Jan 7.

Functional and topological characteristics of mammalian regulatory domains

Affiliations

Functional and topological characteristics of mammalian regulatory domains

Orsolya Symmons et al. Genome Res. 2014 Mar.

Abstract

Long-range regulatory interactions play an important role in shaping gene-expression programs. However, the genomic features that organize these activities are still poorly characterized. We conducted a large operational analysis to chart the distribution of gene regulatory activities along the mouse genome, using hundreds of insertions of a regulatory sensor. We found that enhancers distribute their activities along broad regions and not in a gene-centric manner, defining large regulatory domains. Remarkably, these domains correlate strongly with the recently described TADs, which partition the genome into distinct self-interacting blocks. Different features, including specific repeats and CTCF-binding sites, correlate with the transition zones separating regulatory domains, and may help to further organize promiscuously distributed regulatory influences within large domains. These findings support a model of genomic organization where TADs confine regulatory activities to specific but large regulatory domains, contributing to the establishment of specific gene expression profiles.


Figures

Figure 1.
Figure 1.
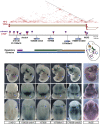
Mapping the distribution of regulatory activities along the genome. (A) Insertion of a regulatory sensor (drawing of sensor) at different distances from an enhancer (blue oval) and different positions relative to its target gene (blue arrow) can report on the domains of action of the enhancer. (B) A total of 734 insertions were characterized for expression in mid-gestation mouse embryos. About 55% of these reported regulatory activities. Insertions with (blue) or without (white) expression were broadly distributed around endogenous gene transcriptional start sites (distribution made with GREAT) (McLean et al. 2010). (C) Examples of the diverse expression patterns obtained in E11.5 embryonic forelimb (left) or forebrain (right). Numbers refer to insertion identifiers used in the TRACER database (Chen et al. 2013).
Figure 2.
Figure 2.
Expression of the regulator sensor is correlated with surrounding enhancers up to large distances. (A) Enrichment of insertions showing LacZ activity in a given tissue relative to limb EP300 binding sites. Enrichment for insertions with expression in the limb (green) compared with random insertions is calculated at increasing distances from the nearest EP300 site (x-axis). Error bars represent one standard deviation from the mean. Enrichments of insertions with activity in other tissues but not in the limb (heart: purple; forebrain: blue; midbrain: red) or with no LacZ activity (gray) are also displayed. Results for EP300 sites from other tissues are shown in Supplemental Figure 1. (B) Comparison of enhancer and sensor activity. Different groups were considered, according to the relative distance between the insertions and the enhancers (number of insertion–enhancer pairs indicated above each bar). The two random data sets are described in the Methods section. The proportions of concordant enhancer–insertion pairs in different groups were compared using Fisher's exact test. (C–E) Examples of concordant enhancer–insertion pairs. The different loci are schematized (enhancer: blue oval with VISTA reference; sensor: drawing of transposon; endogenous genes: arrows or gray bars with black exons), with putative target genes of enhancers indicated by labeling the gene the same color as the enhancer. Photos of representative embryos of the in vivo enhancer assays are from the Vista Enhancer Browser (Visel et al. 2007). (C) The sensor reported the activity of an intronic diencephalon/midbrain enhancer, which likely contributes to the regulation of the distant Lhx2 gene (Gray et al. 2004). (D) Heart-specific expression of the sensor when inserted adjacent to a heart-specific enhancer, possibly regulating the adjacent Myocd gene (Wang et al. 2001). The eye expression shown on the representative transgenic embryo (*) is ectopic. (E) The sensor, inserted next to Znf503 (McGlinn et al. 2008), showed expression in the posterior forelimb, which overlapped with the activity of a distant enhancer (fl, blue/white arrow). The enhancer was also active in the neural tube, but the sensor was not expressed in that region.
Figure 3.
Figure 3.
Non-gene-centric enhancer activities are detected across large distances. (A) The number of insertions that correctly (blue) or partially (light blue) reported the activity of a neighboring tissue-specific enhancer, or showed a different activity (orange). Insertions were grouped depending on their position relative to the enhancer/target gene, as shown below the chart. (B–D) Examples of expression detected with the regulatory sensor (photos) in non-gene-centered situations. Gene (arrows) and enhancer (ovals) activities are color-coded and shown on the embryo outline. (B) An insertion between the En2 and Cnpy1 genes matches their expression at the mid/hindbrain junction (Jukkola et al. 2006), as well as the activity of an enhancer on the far side of En2 (see also Supplemental Fig. 8) (C) Barhl2 expression in the midbrain and diencephalon requires remote enhancers (Saba et al. 2005), and a diencephalon enhancer (hs612) (Visel et al. 2007) is present upstream of this gene. Enhancer activity extends to a downstream insertion. (D) Sall1 gene expression is controlled by multiple enhancers spread in the two surrounding gene deserts, and insertions flanking the gene display overlapping expression patterns.
Figure 4.
Figure 4.
Extended domains of co-regulation correlate with the subdivision of the genome into topological domains. (A–C) Outlines of loci, with genes displayed as arrows and insertions as drawings of the transposon. Regulatory domains and transition zones are labeled, TADs (identified by Hi-C in mouse ES cells) are indicated by green and brown bars and unstructured regions by dashed lines. Hi-C interaction frequencies are represented as a two-dimensional heat map (from Dixon et al. 2012). (A) Multiple insertions in the chr3:7.3–8.3M interval outlined an extended regulatory domain characterized by shared expression in the facial and trunk mesenchyme, and in neural crest derivatives. This domain extends into the adjacent unstructured region (insertion 201179e9), but two telomeric insertions, located in a different TAD, showed different patterns (the proximal limb expression of 181912bc-133 is anterior, whereas insertions in the flanking RD have a more medial expression), defining two transition zones. (B) Multiple insertions in the vicinity of the Foxg1 gene display the typical forebrain (fb) expression of the gene (adapted from Chen et al. 2013, with permission from Elsevier © 2013). Expression in the ear (*) is due to another insertion also present in 177175-emb7. The regulatory domain defined by the gene and the insertions is contained within a single TAD. A more detailed version of this panel is shown in Supplemental Figure 5E. (C) Two insertions in a gene desert between Kcnt2 and Cdc73 are divergently expressed in the limb bud (lb) and forebrain (fb), delineating a transition zone. This coincides with the respective insertions being located in different TADs. (D) Size distribution (y-axis) and relationship with TADs (color-coded) of functionally defined intervals. Only a single regulatory domain (RD) overlaps a TAD boundary. Random permutation of regions 200 kb–1 Mb in length (boxed area), where the size distribution of the different functional categories is not statistically different (Kolmogorov-Smirnov test, P = 0.8560 for RD vs. TZ + A + B; P = 0.9240 for RD vs. TZ), showed that RDs are significantly underrepresented in the “separated TADs” category. (E) Unlike control regions (classes A, B) and transition zones (TZ), RDs show depletion in topological boundaries compared with equally sized, randomly distributed fragments. Gray box-plots represent the results of randomization; red dots, the position of the real data. The depletion is statistically significant (P = 0.009), as indicated by the blue star.
Figure 5.
Figure 5.
Depletion of CTCF and cohesin in regulatory domains reflects the topological segmentation of the genome. Tissue-invariant CTCF sites (bound in more than nine tissues) are significantly depleted (but not absent) in regulatory domains when considering all functionally defined regions (A). However, the statistical significance of this depletion becomes marginal if the comparison is limited to intervals included in TADs, and not compared against the overall genome (B). Constitutive cohesin complex-binding sites (data not shown), or CTCF/cohesin co-occupied regions (C) also showed only a slightly reduced density in RDs, when compared with the part of the genome that is included in TADs.
Figure 6.
Figure 6.
CTCF and cohesin sites are interspersed in regulatory domains. Schematic representation of the large topological/regulatory domain on chr7:75.5M–77.8M. The two genes (Arrdc4 and Nr2f2) are represented as arrows. The corresponding TAD is represented by a two-dimensional heat map (Dixon et al. 2012). Several constitutive CTCF sites (red lollipop, color intensity proportional to cell invariance), largely co-bound by cohesin (purple rings), are interspersed in this interval. Insertions spread across almost 2 Mb showed highly overlapping patterns in the proximal limb (blue arrow, top), face (blue arrow, middle), and at the midbrain/diencephalon boundary (blue arrow, bottom), forming a large regulatory domain. This large domain can be subdivided into smaller tissue-specific landscapes (green, purple, and brown) based on expression patterns displayed by only a subset of the insertions and quantitative differences in LacZ staining intensity. These different regulatory influences overlap with Nr2f2 expression, detected by whole-mount in situ hybridization. In situ hybridization with Arrdc4 probes did not reveal specific expression in E11.5 embryos. Embryos 183036-emb4 and 176069-emb50 were described previously (Ruf et al. 2011).

Similar articles

Cited by

References

    1. Akhtar W, de Jong J, Pindyurin AV, Pagie L, Meuleman W, de Ridder J, Berns A, Wessels LFA, van Lohuizen M, van Steensel B 2013. Chromatin position effects assayed by thousands of reporters integrated in parallel. Cell 154: 914–927 - PubMed
    1. Amano T, Sagai T, Tanabe H, Mizushina Y, Nakazawa H, Shiroishi T 2009. Chromosomal dynamics at the Shh locus: Limb bud-specific differential regulation of competence and active transcription. Dev Cell 16: 47–57 - PubMed
    1. Andrey G, Montavon T, Mascrez B, Gonzalez F, Noordermeer D, Leleu M, Trono D, Spitz F, Duboule D 2013. A switch between topological domains underlies HoxD genes collinearity in mouse limbs. Science 340: 1234167. - PubMed
    1. Aragon L, Martinez-Perez E, Merkenschlager M 2013. Condensin, cohesin and the control of chromatin states. Curr Opin Genet Dev 23: 204–211 - PubMed
    1. Arnold CD, Gerlach D, Stelzer C, Boryń ŁM, Rath M, Stark A 2013. Genome-wide quantitative enhancer activity maps identified by STARR-seq. Science 339: 1074–1077 - PubMed

Publication types