. 2014 Jan;10(1):e1003861.
doi: 10.1371/journal.ppat.1003861. Epub 2014 Jan 2.

STING-dependent type I IFN production inhibits cell-mediated immunity to Listeria monocytogenes

Affiliations

STING-dependent type I IFN production inhibits cell-mediated immunity to Listeria monocytogenes

Kristina A Archer et al. PLoS Pathog. 2014 Jan.

Abstract

Infection with Listeria monocytogenes strains that enter the host cell cytosol leads to a robust cytotoxic T cell response resulting in long-lived cell-mediated immunity (CMI). Upon entry into the cytosol, L. monocytogenes secretes cyclic diadenosine monophosphate (c-di-AMP) which activates the innate immune sensor STING leading to the expression of IFN-β and co-regulated genes. In this study, we examined the role of STING in the development of protective CMI to L. monocytogenes. Mice deficient for STING or its downstream effector IRF3 restricted a secondary lethal challenge with L. monocytogenes and exhibited enhanced immunity that was MyD88-independent. Conversely, enhancing STING activation during immunization by co-administration of c-di-AMP or by infection with a L. monocytogenes mutant that secretes elevated levels of c-di-AMP resulted in decreased protective immunity that was largely dependent on the type I interferon receptor. These data suggest that L. monocytogenes activation of STING downregulates CMI by induction of type I interferon.


Conflict of interest statement

I have read the journal's policy and have the following conflicts: Daniel A. Portnoy has a consulting relationship with a financial interest in Aduro Biotech, and both he and the company stand to benefit from the commercialization of this research. This does not alter our adherence to all PLOS polices on sharing data and materials.

Figures
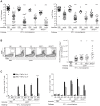
Figure 1
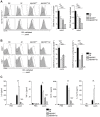
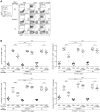
Figure 1. Mice lacking the STING signaling pathway generate a protective adaptive immune response following L. monocytogenes reinfection.
B6, Gt, IRF3−/− and IRF3/7−/− mice were immunized intravenously with 103 CFU ActALm-OVA (ΔactA) (open circles) or administered PBS (closed circles) and 30–38 days later challenged with 2×10⁵ CFU WT Lm-OVA. Three days post challenge, A. bacterial CFU in the spleens and livers were enumerated. The dashed line represents the limit of detection. B. Splenocytes were stained with anti-mouse CD8, CD44 and Kb/OVA257–264 tetramer and analyzed by flow cytometry. Quantitative analysis shows the total number of Kb/OVA257–264 tetramer+ CD44+ CD8+ T cells/spleen. C. Splenocytes were either unstimulated (un) or stimulated with OVA257–264 (OVA) or LLO190–201 (LLO) peptides followed by intracellular staining with anti-mouse IFN-γ, TNF-α and IL-2. Quantitative analysis shows the percentage of IFN-γ+/TNF-α+/IL-2 (solid bars) or IFN-γ+/TNF-α+/IL-2+ (lined bars) within the CD8+ or CD4+ population. Data are presented as the cumulative results from 5–12 (A), 3–6 (B) or 2–4 (C, mean ± SEM) independent experiments using at least five mice per group. Asterisks represent significance as compared to ΔactA-immunized B6 mice (*p<0.05, **p<0.005, ***p<0.0005).
Figure 2
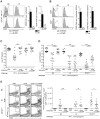
Figure 2. MyD88 and STING contribute to dendritic cell and T cell activation in vivo.
B6 (closed bars), Gt (open bars), MyD88−/− (lined bars) and MyD88−/−Gt (dotted bars) mice were intravenously injected with either PBS (shaded histogram) or 105 CFU ActALm-OVA (ΔactA) (black line). One day post injection, A. splenocytes were isolated and stained with anti-mouse CD86, CD40, CD11b, CD11c or B. anti-mouse CD8, CD4 and CD69 and analyzed by flow cytometry. Quantitative analysis shows the fold increase of median fluorescence intensity over uninfected mice. C. Serum was measured for IL-6 and TNF-α, MCP-1 and IL-12p70 by Cytometric Bead Array. Data represent the mean ± SEM from 3 independent experiments with 3 mice per group (ns = not significant, *p<0.05, **p<0.005, ***p<0.0005).
Figure 3
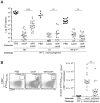
Figure 3. Mice lacking MyD88 and STING are protected from secondary challenge.
B6, MyD88−/− and MyD88−/−Gt mice were immunized intravenously with 103 CFU ActALm-OVA (ΔactA) (open circles) or administered PBS (closed circles) and 30–38 days following immunization, challenged with 2×10⁵ CFU WT Lm-OVA. Three days post challenge, A. bacterial numbers in the spleens and livers were enumerated. An X marks each mouse that succumbed to infection prior to the conclusion of experiment. The dashed line represents the limit of detection. B. Splenocytes were stained with anti-mouse CD8, CD44 and Kb/OVA257–264 tetramer and analyzed by flow cytometry. Quantitative analysis shows the total number of Kb/OVA257–264 tetramer+ CD44+ CD8+ T cells/spleen. Data are presented as the cumulative results from 4–6 (A) or 3 (B) independent experiments (ns = not significant, *p<0.05, **p<0.005, ***p<0.0005).
Figure 4
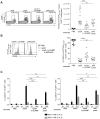
Figure 4. Administration of c-di-AMP during immunization inhibits CD8+ T cell expansion and protective immunity upon L. monocytogenes reinfection.
A and B. B6 or Gt mice were intravenously injected with either 50 µg c-di-AMP (black line) or PBS (shaded histogram) and splenocytes were isolated 24 hours were stained with either A. anti-mouse CD86 and CD40 or B. anti-mouse CD8, CD4 and CD69 and analyzed by flow cytometry. Data are quantified as the fold increase of median fluorescence intensity over uninfected mice and presented as the mean ± SEM from 3 independent experiments using 3 mice per group (ND = not detectable). C. B6 mice were immunized intravenously with either 103 ActALm-OVA (ΔactA) or 104 LLOLm-OVA (Δhly) in the presence (open triangles) or absence (open circles) of 50 or 100 µg c-di-AMP, or D. B6, Gt or IRF3/7−/− mice were immunized with either 103 CFU ΔactA in the presence (open triangles) or absence (open circles) of 100 µg c-di-AMP. Naive controls were administered sterile PBS (closed circles). Mice were challenged 30–38 days post immunization with 2×10⁵ CFU WT Lm-OVA and 3 days later CFU were enumerated in spleens. The dashed line represents limit of detection. E. Splenocytes isolated from D were stained with anti-mouse CD8, CD44 and Kb/OVA257–264 tetramer and analyzed by flow cytometry. Quantitative analysis shows the total number of Kb/OVA257–264 tetramer+ CD44+ CD8+ T cells/spleen. Data are presented as the cumulative results from 3 (C and D) or 2–3 (E) independent experiments (ns = not significant, *p<0.05, **p<0.005, ***p<0.0005).
Figure 5
Figure 5. Immunization with a c-di-AMP hyper-secreting strain of L. monocytogenes reduces CD8+ T cell expansion and protective immunity following challenge.
B6, Gt or IRF3/7−/− mice were immunized with either 103 CFU ΔactA (open circles) or tetRActALm-OVA (tetRΔactA) (open triangles). Naive controls were administered sterile PBS (closed circles). Mice were challenged 30–38 days post immunization with 2×10⁵ CFU WT Lm-OVA and 3 days later A. CFU were enumerated in spleens. The dashed line represents limit of detection. B. Splenocytes were stained with anti-mouse CD8, CD44 and Kb/OVA257–264 tetramer and analyzed by flow cytometry. Quantitative analysis shows the total number of Kb/OVA257–264 tetramer+ CD44+ CD8+ T cells/spleen. Data are presented as the cumulative results from 3–4 independent experiments (ns = not significant, *p<0.05, **p<0.005, ***p<0.0005).
Figure 6
Figure 6. T cell priming is inhibited in the presence of enhanced STING activation.
B6 mice were immunized with either 103 CFU ActALm-OVA (ΔactA) (open circles), ΔactA in the presence of 50 µg c-di-AMP or tetRActALm-OVA (tetRΔactA) (open triangles). Naive controls were administered sterile PBS (closed circles). Splenocytes were isolated 7 days post immunization and stained with anti-mouse CD8, CD44, CD62L and Kb/OVA257–264 tetramer and analyzed by flow cytometry. A. Quantitative analysis shows the total number of Kb/OVA257–264 tetramer+ CD44+ CD8+ T cells/spleen. B. Histograms represent mice administered PBS (shaded), ΔactA (solid line) or ΔactA in the presence of c-di-AMP or tetRΔactA (dotted line). Quantitative analysis shows the percentage of CD62L high-expressing cells of the CD8+ CD44+ Kb/OVA257–264 tetramer+ population. C. Splenocytes were either unstimulated (un) or stimulated with OVA257–264 (OVA) or LLO190–201 (LLO) peptides followed by intracellular staining for anti-mouse IFN-γ, TNF-α and IL-2. Quantitative analysis shows the percentage of IFN-γ+/TNF-α+/IL-2 (solid bars) or IFN-γ+/TNF-α+/IL-2+ (lined bars) within the CD8+ or CD4+ population. Data are presented as the cumulative results from 2–3 independent experiments (ns = not significant, *p<0.05, **p<0.005, ***p<0.0005).
Figure 7
Figure 7. Mice lacking type I IFNs are partially rescued from c-di-AMP-mediated immune inhibition.
A. B6 or IFNAR1−/− mice were immunized with 103 CFU ActALm-OVA (ΔactA) in the presence (open triangles) or absence (open circles) of 100 µg c-di-AMP or B. tetRActALm-OVA (tetRΔactA) (open triangles). Naïve mice were administered PBS (closed circles). Mice were challenged 30–38 days later with 2×10⁵ CFU WT Lm-OVA and 3 days post challenge, CFU were enumerated from spleens. The dashed line represents limit of detection. Data are presented as the cumulative results from 3 independent experiments (ns = not significant, *p<0.05, **p<0.005, ***p<0.0005).
Figure 8
Figure 8. Type I IFN-mediated immune suppression is T cell extrinsic.
A. B6, IFNAR1−/− and Gt mice were injected with 1∶1 ratio WT GFP+ Ly5.2+ and IFNAR1−/− Ly5.1+ OT-I cells 1 day prior to immunization with ActALm-OVA (ΔactA) in the presence (open triangles) or absence (open circles) of 50 µg c-di-AMP or administered PBS (closed circles). Splenocytes were isolated 7 days later and stained with anti-mouse CD8 and CD45.1 and analyzed by flow cytometry. Values in representative FACs plots show the median percentage of WT or IFNAR1−/− OT-I cells ± SEM within the CD8+ T cell population. B. Quantitative analysis shows the percentage (left panels) within the CD8+ T cell population or the total number of CD8+ T cells/spleen (right panels) of WT OT-I T cells (top panels) and IFNAR1−/− OT-I T cells (bottom panels). Data are presented as the cumulative results from 2 of 3 independent experiments (ns = not significant, *p<0.05, **p<0.005, ***p<0.0005).

Similar articles

Cited by

References

    1. Harty JT, Tvinnereim AR, White DW (2000) CD8+ T cell effector mechanisms in resistance to infection. Annual review of immunology 18: 275–308. - PubMed
    1. Pamer EG (2004) Immune responses to Listeria monocytogenes. Nat Rev Immunol 4: 812–823. - PubMed
    1. Schenten D, Medzhitov R (2011) The control of adaptive immune responses by the innate immune system. Advances in immunology 109: 87–124. - PubMed
    1. Witte CE, Archer KA, Rae CS, Sauer JD, Woodward JJ, et al. (2012) Innate immune pathways triggered by Listeria monocytogenes and their role in the induction of cell-mediated immunity. Advances in immunology 113: 135–156. - PubMed
    1. Leber JH, Crimmins GT, Raghavan S, Meyer-Morse NP, Cox JS, et al. (2008) Distinct TLR- and NLR-mediated transcriptional responses to an intracellular pathogen. PLoS Pathog 4: e6. - PMC - PubMed

Publication types

MeSH terms