. 2014 Feb 1;192(3):1231-40.
doi: 10.4049/jimmunol.1300720. Epub 2014 Jan 3.

The SOCS3-independent expression of IDO2 supports the homeostatic generation of T regulatory cells by human dendritic cells

Affiliations

The SOCS3-independent expression of IDO2 supports the homeostatic generation of T regulatory cells by human dendritic cells

Sara Trabanelli et al. J Immunol. .

Abstract

Dendritic cells (DCs) are professional APCs that have a role in the initiation of adaptive immune responses and tolerance. Among the tolerogenic mechanisms, the expression of the enzyme IDO1 represents an effective tool to generate T regulatory cells. In humans, different DC subsets express IDO1, but less is known about the IDO1-related enzyme IDO2. In this study, we found a different pattern of expression and regulation between IDO1 and IDO2 in human circulating DCs. At the protein level, IDO1 is expressed only in circulating myeloid DCs (mDCs) and is modulated by PGE2, whereas IDO2 is expressed in both mDCs and plasmacytoid DCs and is not modulated by PGE2. In healthy subjects, IDO1 expression requires the presence of PGE2 and needs continuous transcription and translation, whereas IDO2 expression is constitutive, independent from suppressor of cytokine signaling 3 activity. Conversely, in patients suffering from inflammatory arthritis, circulating DCs express both IDO1 and IDO2. At the functional level, both mDCs and plasmacytoid DCs generate T regulatory cells through an IDO1/IDO2-dependent mechanism. We conclude that, in humans, whereas IDO1 provides an additional mechanism of tolerance induced by proinflammatory mediators, IDO2 is stably expressed in steady-state conditions and may contribute to the homeostatic tolerogenic capacity of DCs.


Conflict of interest statement

Conflict-of-interest disclosure: All the Authors of this research have no conflict of interest to disclose, except for R. Metz and G.C. Prendergast. R.M. and G.C.P. declare a conflict of interest with regard to employer/consultancy roles with New Link Genetics Corporation, which is engaged in the clinical development of IDO inhibitors.

Figures

Figure 1
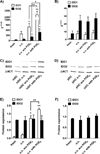
Figure 1. Expression of IDO1 and IDO2 in blood DC
Human mDC and pDC were isolated from healthy donors’ PBMC by using magnetic beads. DC were tested freshly purified or after an over-night (o.n.) incubation in RPMI 1640 alone or in presence of IL-1β (10 ng/ml), IL-6 (10 ng/ml) and TNF-α (10 ng/ml) with or without (w/o in figure) PGE2 (1 µg/ml). Cells were lysed and RNA and protein were extracted. mRNA expression of IDO1 and IDO2 (normalized to GAPDH) was evaluated by real-time RT-PCR in mDC (A) and pDC (B). Universal human RNA was used as reference and taken as value of 1. Data are expressed as the mean ± SEM of 12 independent experiments.* p<0.05, ** p<0.01 vs. o.n. or versus o.n. w/o PGE2, where indicated. (C–F) IDO1, IDO2 and β-actin (βACT in figure) protein expression in fresh or cultured mDC (C, E) and pDC (D, F) was determined by Western blotting. (C, D) Data shown are representative results from 1 of 4 independent experiments, each performed by bulking protein lysate of either mDC or pDC of the same three donors. (E, F) Protein expression was quantified by band densitometric analysis and expressed as the ratio between IDO1 (or IDO2) on β-actin band intensity. Data are expressed as the mean ± SEM of 4 independent experiments.* p<0.05, ** p<0.01 vs. o.n. or versus o.n. w/o PGE2, where indicated.
Figure 2
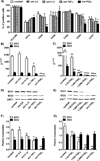
Figure 2. Expression of IDO1 and IDO2 in Mo-DC
Human CD14+ monocytes were purified form healthy donors’ PBMC by using magnetic beads and cultured 5 days with 50 ng/ml GM-CSF and 800U/ml IL-4 to obtain immature Mo-DC. DC phenotype, mRNA expression of IDO1 and IDO2 (normalized to GAPDH) and protein expression of IDO1, IDO2 and β-actin (βACT in figure) were evaluated by flow cytometry, real-time RT-PCR and Western blotting, respectively. (A, B, D and F) Immature Mo-DC were cultured for 48h with the complete cocktail or with combinations of 3 out of 4 cytokines of the cocktail (in figure w/o means without) and evaluated for phenotype (A) and IDO1 and IDO2 expression (B, D and F); (C, E and G) Mo-DC were matured with 10 ng/ml IL-1β, 10 ng/ml IL-6, 10 ng/ml TNF-α in presence of decreasing doses of PGE2 : 1 µg/ml (the normal concentration in the cocktail), 0.02 µg/ml (1:50 of the normal concentration), 0.002 µg/ml (1:500 of the normal concentration), 0.0004 µg/ml (1:2500 of the normal concentration) or 0 µg/ml (without (w/o) PGE2) and evaluated for IDO1 and IDO2 expression. Universal human RNA was used as reference and taken as value of 1. Data are expressed as the mean ± SEM of 12 independent experiments.* p<0.05, ** p<0.01 vs Mo-DC matured with the complete cocktail. (D, E) Western blotting data are representative results from 5 independent experiments and (F, G) protein expression was quantified by band densitometric analysis and expressed as the ratio between IDO1 (or IDO2) on β-actin band intensity. Data are expressed as the mean ± SEM of 5 independent experiments.* p<0.05, ** p<0.01 vs. complete cocktail.
Figure 3
Figure 3. IDO1 and IDO2 regulation in Mo-DC
IDO1, IDO2 and β-actin (βACT in figure) protein expression was evaluated by Western blotting (A) and quantified by densitometric analysis (B) in immature Mo-DC and in Mo-DC treated with 1 µg/ml actinomycin d (Act-d in figure), to inhibit gene transcription, or 10 µg/ml cycloheximide (Chx in figure), to inhibit protein translation, 30 min before maturation with the cytockine cocktail either without (w/o in figure) or with PGE2 (1 µg/ml). (B) Protein expression was quantified by band densitometric analysis and expressed as the ratio between IDO1 (or IDO2) on β-actin band intensity. Data are expressed as the mean ± SEM of 4 independent experiments.** p<0.01 vs. immature.
Figure 4
Figure 4. IDO1 and IDO2 degradation in Mo-DC
(A and B) IDO1, IDO2 and SOCS3 protein expression was evaluated by Western blotting after SOCS3 immunoprecipitation. (A) Immature Mo-DC were treated for 24 h with RPMI 1640 (immature in figure) or with the cytokine cocktail either with or without PGE2, then DC were lysed and SOCS3 was immunoprecipitated with an anti-SOCS3 antibody; (A right) 1 h before that treatment, Velcade (3 µM for immature DC, 20 µM for DC matured without PGE2 and 30 µM for DC matured with PGE2) was added to immature Mo-DC cultures to inhibit proteasomal activity, then DC were treated as above (i.e. cultured 24 h either with RPMI 1640, or the cytokine cocktail either with or without PGE2), lysed and SOCS3 was immunoprecipitated with an anti-SOCS3 antibody. Data shown are representative results from 1 of 3 independent experiments. (B) Protein expression was quantified by band densitometric analysis and expressed as the ratio between IDO1 (or IDO2) on SOCS3 band intensity. Before SOCS3 immunoprecipitation, IDO1 (C) and IDO2 (Ci) protein expression was quantified by band densitometric analysis in whole cell lysates and expressed as the ratio between IDO1 (or IDO2) on β-actin band intensity. Data are expressed as the mean ± SEM of 3 independent experiments.** p<0.01 vs. w/o Velcade.
Figure 5
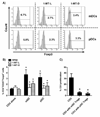
Figure 5. Treg generation by blood DC
Circulating mDC and pDC were cultured with autologous CD3+ T cells (1:10) for 24 h in the presence or absence of 1-MT-L or 1-MT-D (1 mM). At the end of culture, cells were stained for CD4, CD25 and Foxp3. Foxp3+ T cells were gated as CD4+CD25+. (A) Representative results for Foxp3+ T cells after coculture with myeloid (upper) or plasmacytoid (lower) DC in the presence or absence of 1-MT-L or 1-MT-D. (B) Histograms represent the mean ± SEM of the percentage of T cells coexpressing CD4, CD25 and Foxp3 of 3 independent experiments. * p<0.05 vs. the percentage of CD4+CD25+Foxp3+ cultured without DC (CD3 alone), and vs. RPMI 1640 within the condition mDC or pDC. (C) To test their immunosuppressive activity, CD4+CD25+ T cells obtained at the end of the coculture with mDC or pDC were purified by using magnetic beads and added (1:10) to CD3+ T cells stimulated with PHA (1 µg/ml). Histograms represent the mean ± SEM of 3 independent experiments. * p<0.05 vs. CD3+ T cells alone (CD3).
Figure 6
Figure 6. IDO1 and IDO2 activity in Mo-DC
(A–B) DC were matured with the cytokine cocktail and cultured with or without 1-MT-L or –D (1 mM) (A) in presence of 500 µM L-tryptophan for 4 h or (B) with CD3+ T cells (1:10) for 24 h. (A) IDO1 and IDO2 enzymatic activity was evaluated with a spectrophotometric analysis as the production of kynurenine in the supernatants. Data are expressed as the mean ± SEM of 7 independent experiments.* p<0.05, ** p<0.01 vs. RPMI 1640. (B) IDO1 and IDO2 biologic activity was evaluated by quantifying the percentage of T cells coexpressing CD4, CD25 and Foxp3 of 7 independent experiments. * p<0.05, ** p<0.01 vs. RPMI 1640. To directly inhibit IDO1 or IDO2 expression, immature DC were nucleofected with a CTR-siRNA or with IDO1- or IDO2-specific siRNA and after 24 h matured with the cytokine cocktail for 48 h. (C–E) The expression of IDO1 and IDO2 after siRNA treatment was evaluated by (C) real-time RT-PCR and (D) Western blotting. (E) Histograms represent the mean ± SEM of mRNA expression (n=5) of IDO1 and IDO2 (normalized to GAPDH). Universal human RNA was used as reference and taken as value of 1. ** p<0.01, vs. CTR-siRNA. (D) Western blotting expression of IDO1, IDO2 and β-actin (βACT in figure) is the representative result from 5 independent experiments. (E) Protein expression was quantified by band densitometric analysis and expressed as the ratio between IDO1 (or IDO2) on β-actin band intensity. Data are expressed as the mean ± SEM of 5 independent experiments.** p<0.01 vs. siRNA CTR. (F) DC were cultured in presence of 500 µM L-tryptophan for 4 h and supernatants were collected. IDO1 and IDO2 enzymatic activity was evaluated with a spectrophotometric analysis as the production of kynurenine in the supernatants. Data are expressed as the mean ± SEM of 3 independent experiments.* p<0.05, ** p<0.01 vs. siRNA CTR. (G and H) DC were cultured with CD3+ T cells (1:10) for 24 h. At the end of culture, cells were stained for CD4, CD25 and Foxp3. Foxp3+ T cells were gated as CD4+CD25+. (G) Representative results for Foxp3+ T cells after coculture with DC treated with CTR-siRNA or IDO1- or IDO2-specific siRNA; (H) Histograms represent the mean ± SEM of the percentage of T cells coexpressing CD4, CD25 and Foxp3 of 3 independent experiments. * p<0.05, ** p<0.01 vs. siRNA CTR. (I) To validate their immunosuppressive activity, CD4+CD25+ T cells obtained at the end of the coculture with DC treated with CTR-siRNA (Treg siRNA CTR), IDO1-specific (Treg siRNA IDO1) or IDO2-specific siRNA (Treg siRNA IDO2) were purified by using magnetic beads and added (1:10) to CD3+ T cells stimulated with PHA (1 µg/ml). Histograms represent the mean ± SEM of 3 independent experiments. * p<0.05 vs. CD3+ T cells alone (CD3).
Figure 7
Figure 7. Expression of IDO1 and IDO2 in blood DC of inflammatory arthritis
Human total blood DC were isolated from healthy donors’ PBMC and from PBMC of patients suffering from rheumatoid arthritis (RA), psoriatic arthritis (Pso AR) or ankylosing spondylitis (Ank Spo) by using magnetic beads. Healthy DC were tested freshly purified or after an over-night (o.n.) incubation in RPMI 1640 alone or in presence of IL-1β (10 ng/ml), IL-6 (10 ng/ml) and TNF-α (10 ng/ml) with or without (w/o in figure) PGE2 (1 µg/ml); patients’ DC were tested freshly purified. Cells were lysed and RNA and protein were extracted. mRNA expression of IDO1 and IDO2 (normalized to GAPDH) was evaluated by real-time RT-PCR in healthy DC (A) and patients’ DC (B). Universal human RNA was used as reference and taken as value of 1. Data are expressed as the mean ± SEM of 8 independent experiments.* p<0.05, ** p<0.01 vs. o.n., versus o.n. w/o PGE2 where indicated (A) or versus healthy DC (B). (C and D) IDO1, IDO2 and β-actin (βACT in figure) protein expression in freshly purified DC of an healthy subject and of a patient suffering from rheumatoid arthritis was determined by Western blotting. Data shown are representative results from 1 of 4 independent experiments. Rheumatoid arthritis was chosen as representative of the three inflammatory arthritis. (D) Protein expression was quantified by band densitometric analysis and expressed as the ratio between IDO1 (or IDO2) on β-actin band intensity. Data are expressed as the mean ± SEM of 4 independent experiments.** p<0.01 vs. healthy.

Similar articles

Cited by

References

    1. MacDonald KP, Munster DJ, Clark GJ, Dzionek A, Schmitz J, Hart DN. Characterization of human blood dendritic cell subsets. Blood. 2002;100:4512–1520. - PubMed
    1. Caux C, Vanbervliet B, Massacrier C, Dezutter-Dambuyant C, de Saint-Vis B, Jacquet C, Yoneda K, Imamura S, Schmitt D, Banchereau J. CD34+ hematopoietic progenitors from human cord blood differentiate along two independent dendritic cell pathways in response to GM-CSF+TNF alpha. J. Exp. Med. 1996;184:695–706. - PMC - PubMed
    1. Sallusto F, Lanzavecchia A. Efficient presentation of soluble antigen by cultured human dendritic cells is maintained by granulocyte/macrophage colony–stimulating factor plus interleukin 4 and downregulated by tumor necrosis factor alpha. J. Exp. Med. 1994;179:1109–1118. - PMC - PubMed
    1. Finkelman FD, Lees A, Birnbaum R, Gause WC, Morris SC. Dendritic cells can present antigen in vivo in a tolerogenic or immunogenic fashion. J. Immunol. 1996;157:1406–1414. - PubMed
    1. Mellor AL, Munn DH. Tryptophan catabolism and T-cell tolerance: immunosuppression by starvation? Immunol. Today. 1999;20:469–473. - PubMed

Publication types

MeSH terms