. 2014 May 15;23(10):2527-41.
doi: 10.1093/hmg/ddt644. Epub 2013 Dec 30.

Gene dosage-dependent rescue of HSP neurite defects in SPG4 patients' neurons

Affiliations

Gene dosage-dependent rescue of HSP neurite defects in SPG4 patients' neurons

Steven Havlicek et al. Hum Mol Genet. .

Abstract

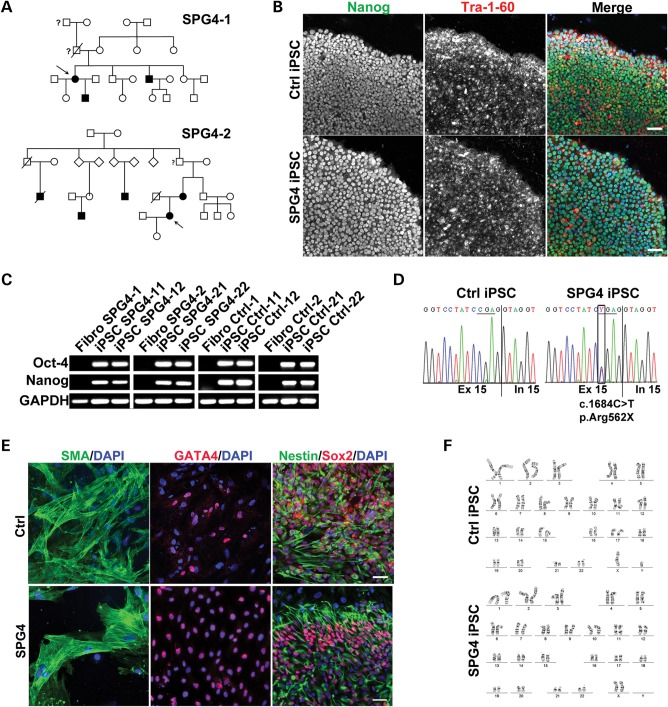
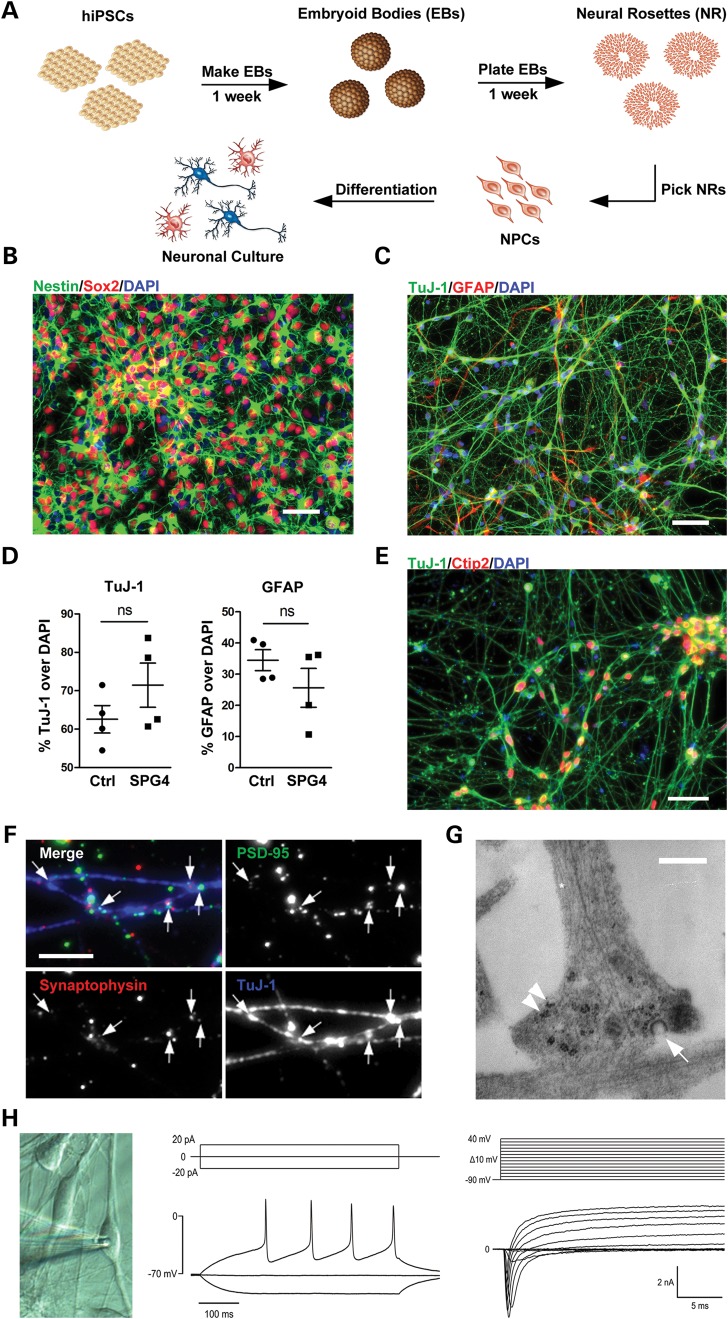
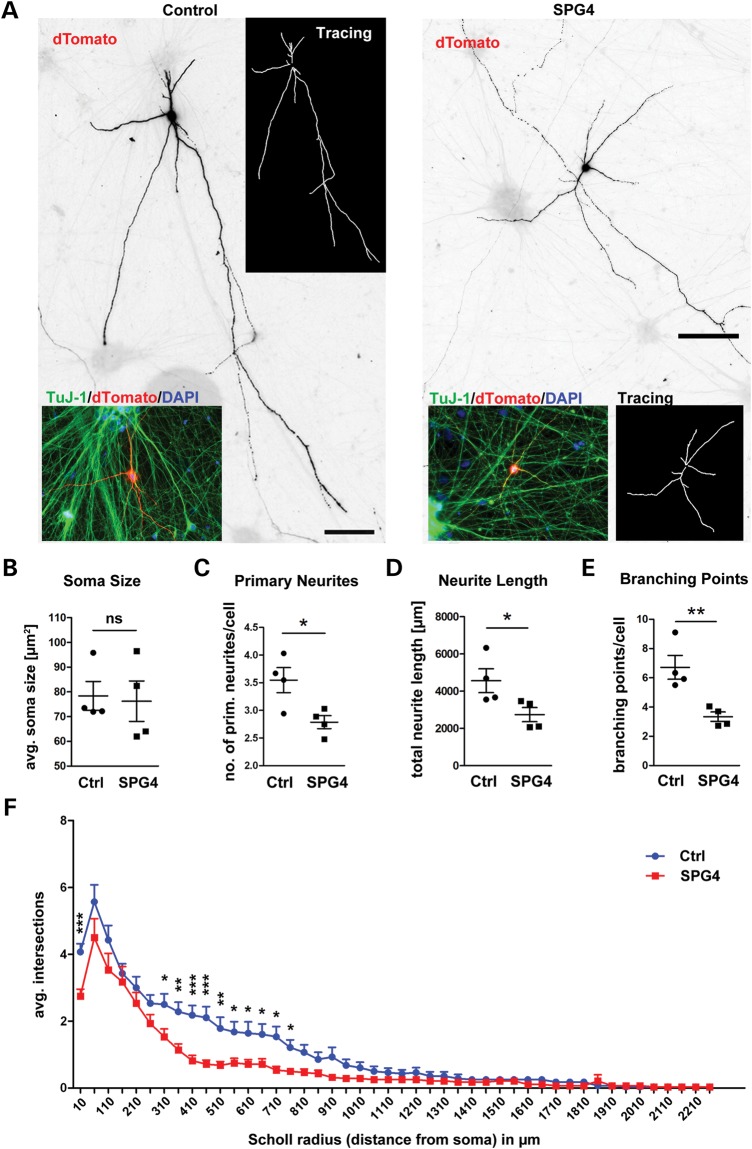
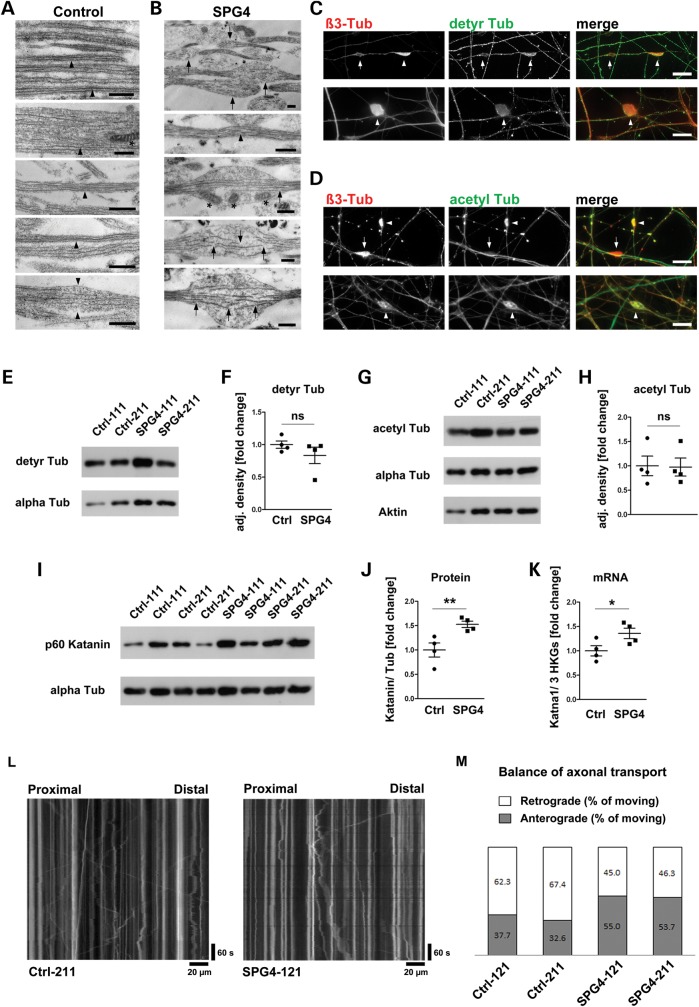
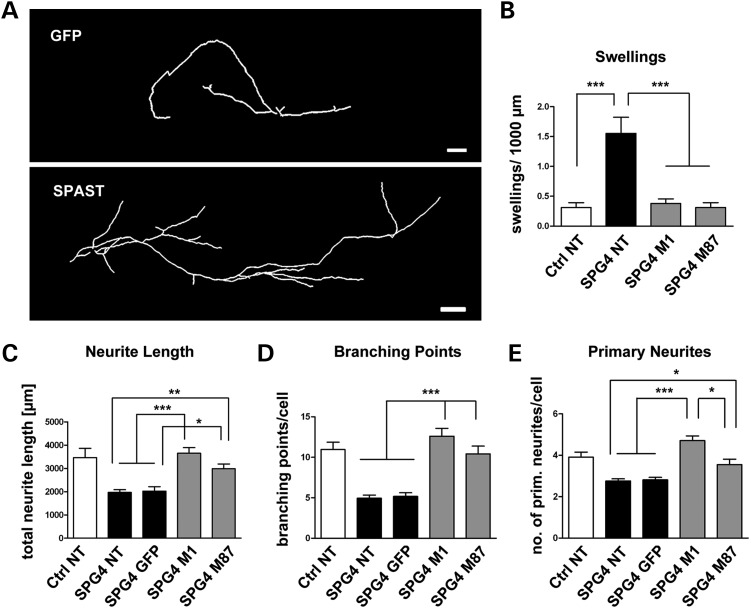
The hereditary spastic paraplegias (HSPs) are a heterogeneous group of motorneuron diseases characterized by progressive spasticity and paresis of the lower limbs. Mutations in Spastic Gait 4 (SPG4), encoding spastin, are the most frequent cause of HSP. To understand how mutations in SPG4 affect human neurons, we generated human induced pluripotent stem cells (hiPSCs) from fibroblasts of two patients carrying a c.1684C>T nonsense mutation and from two controls. These SPG4 and control hiPSCs were able to differentiate into neurons and glia at comparable efficiency. All known spastin isoforms were reduced in SPG4 neuronal cells. The complexity of SPG4 neurites was decreased, which was paralleled by an imbalance of axonal transport with less retrograde movement. Prominent neurite swellings with disrupted microtubules were present in SPG4 neurons at an ultrastructural level. While some of these swellings contain acetylated and detyrosinated tubulin, these tubulin modifications were unchanged in total cell lysates of SPG4 neurons. Upregulation of another microtubule-severing protein, p60 katanin, may partially compensate for microtubuli dynamics in SPG4 neurons. Overexpression of the M1 or M87 spastin isoforms restored neurite length, branching, numbers of primary neurites and reduced swellings in SPG4 neuronal cells. We conclude that neurite complexity and maintenance in HSP patient-derived neurons are critically sensitive to spastin gene dosage. Our data show that elevation of single spastin isoform levels is sufficient to restore neurite complexity and reduce neurite swellings in patient cells. Furthermore, our human model offers an ideal platform for pharmacological screenings with the goal to restore physiological spastin levels in SPG4 patients.


Figures

Figure 1.
Figure 1.
Pedigrees of SPG4 patients and characteristics of hiPSC. (A) Pedigrees of patients included in the study (arrows). (B) Patients' and control hiPSCs are morphologically similar to human embryonic stem cells, have well-defined borders and express the pluripotency-associated proteins Nanog and Tra-1-60. Representative images of Ctrl-11 and SPG4-21. (C) Patient and control hiPSCs but not fibroblasts express endogenous Nanog and Oct-4 transcripts as shown by RT–PCRs. (D) All patient hiPSCs were sequenced for the presence of the heterozygous SPG4 mutation c.1684C>T (p.R562X) as shown here for SPG4-21. (E) Undirected differentiation of all patient and control hiPSCs gave rise to progeny of all three germ layers. Representative images shown: SMA (mesoderm), Gata4 (endoderm) and Nestin/Sox2 double-positive cells (ectoderm). (F) All hiPSCs maintained a normal stable karyotype by G-banding analysis. Representative karyograms of Ctrl-11 and SPG4-21. Scale bars in (B) and (E) are 50 µm.
Figure 2.
Figure 2.
Generation and characterization of neuronal cultures. (A) The schematic view of the neural differentiation protocol. (B) Neural precursor cell (NPC) lines coexpress the early neural precursor markers Nestin and Sox2. (C) Neuronal cultures express neuronal (TuJ-1) and glial (GFAP) markers. (D) Statistical analysis for TuJ-1 and GFAP (% over DAPI) revealed no difference between patients and controls. Plotted are means of each line, n represents two independent experiments per line in triplicates. Data shown as mean ± standard error mean (SEM). (E) Staining for the cortical marker Ctip2 and TuJ-1 is shown. (F) Labeling for Synaptophysin and PSD-95 after 6 weeks of differentiation reveal punctuate staining in close proximity to crossing neurites indicating synapse formations. (G) Ultrastructural analysis further indicates synapse formation. Axon-like process containing microtubule structures (asterisk) forms a terminal button containing ribosomes (arrowheads) and vesicles (arrow). (H) Both, control and SPG4 differentiated neuronal cells display voltage-gated sodium and potassium channels (right column, voltage-clamp recordings) and fire action potentials (left column, current-clamp recordings, cells were held at −70 mV), reminiscent of neurons. Scale bars 50 µm in (B, C and E); 5 µm in (F) and 500 nm in (G).
Figure 3.
Figure 3.
Differential expression of spastin isoforms in SPG4 patients. (A) Comparison of spastin expression in different human cell types by western blotting: Hu prim Astro = human primary cerebellar astrocytes, NPC = hiPSC-derived NPCs. The M87 and M87ΔEx4 isoforms are the predominant bands. It is noteworthy that only NPCs and neuronal cultures, but not astrocytes or non-neuronal cells, show expression of isoforms bigger than 60 kDa (faint bands). (B) Significant reduction in spastin protein levels is already evident in fibroblast cultures from patients. Right image shows the fold changes in the adjusted density of spastin (normalized against GAPDH). n = 3 replicates, data shown as means ± SEM. (C) Neuronal cultures show a reduction in expression of the M87 isoforms (short exposure, middle panel, 58% of M87 isoforms (P ≤ 0.0001) and the M1 isoforms [longer exposure, top panel, 66% M1 isoforms (P = 0.004)], in patient samples. Protein amounts loaded on gels are 20 µg per lane. (D) Imaging of endogenous spastin levels in neuronal cultures revealed an average reduction in spastin to 50.3% in SPG4 samples. n = 2 per line. Data shown as means ± SEM.
Figure 4.
Figure 4.
Significant decrease in neurite length and branching points in SPG4 neurons. (A) Neuronal cultures were transfected with pEF1-dTomato to visualize individual cells. Representative images of transfected neuronal control (left) and patient (right) neurons. Neurite tracings are shown in white inserts. (B) No difference in the average soma sizes between control and SPG4. n = two experiments in triplicates, data shown as means ± SEM. (C) The average number of primary neurites per cell is significantly decreased. (D) The average neurite length is significantly decreased in SPG4 neurons. (E) The average number of branching points is significantly decreased in SPG4 neuronal cultures. (C–E) Evaluation of transfected cells shown in (A). n = minimum of 21 cells per line with a total of 96 patient cells and 116 control cells from 4 to 6 wells. (F) Scholl analysis revealed a significant reduction in branching, especially in the proximal regions close to the soma (radii 310–860 µm) in SPG4 neurons and confirmed the reduction in primary neurites (10 µm radius). N = 20 cells per group. Data shown as means ± SEM.
Figure 5.
Figure 5.
Ultrastructural and biochemical analyses of neurite swellings in SPG4 lines. (A) Multiple neurites showing regularly organized microtubule structures (arrowheads) and occasional mitochondria (asterisk in second panel) in control cells. Rarely, control neurites show mild focal bulging of the plasma membrane (arrowheads in bottom panel). (B) Most of SPG4 neuronal cells display prominent neurite swellings with disrupted microtubules (arrows) and occasional accumulation of mitochondria (asterisks in middle panel). Rarely, neurites only containing regularly organized microtubule structures are present in SPG4 lines (arrowhead in second panel). (C) The majority of swellings (arrowheads) did not stain for detyr Tub. Some swellings were devoid of tubulin staining (arrow). (D) The majority of swellings (arrowheads), but not all (arrow), stained intensely for acetylated tubulin (acetyl Tub). (E) Representative western blot of detyr Tub levels in two control and two SPG4 neuronal cultures. (F) Quantification of detyr Tub levels normalized against total alpha Tub levels revealed no difference in all four SPG4 lines compared with all four controls. (G) Representative western blot of acetyl Tub levels in two control and two SPG4 neuronal cultures. (H) Quantification of acetyl Tub levels normalized against total alpha Tub levels revealed no difference in all four SPG4 lines compared with all four controls. (I) Representative western blot of p60 katanin levels in control and SPG4 neuronal cultures. (J) Quantification of p60 katanin levels normalized against total alpha Tub levels revealed a significant increase in all SPG4 lines compared with controls (P = 0.008). (K) qRT–PCRs confirmed upregulation of Katna1 (gene encoding p60 katanin) mRNA levels in all SPG4 lines. mRNA levels were normalized against three housekeeping genes (HKGs = HPRT, GAPDH and β2M). Scale bars 500 nm (A and B) and 10 µm (C and D). (L) Representative kymographs of axonal mitochondria transport in Ctrl and SPG4. (M) Balance of anterograde and retrograde transport events in Ctrl and SPG4 lines (P = 0.007, χ2 test). Western blot data quantified from at least triplicates of two independent differentiations each. Data shown as means ± SEM.
Figure 6.
Figure 6.
Reduction in neurite swellings and restoration neurite complexity by lentiviral overexpression of M1 or M87 SPAST. (A) Tracings of cells overexpressing GFP or the full-length M1 isoform of spastin after lentiviral transduction with an empty vector or by a pCAG-SPAST(M1)-IRES-GFP/or pCAG-SPAST(M87)-IRES-GFP vector, respectively. (B) Overexpression of M1 or M87 spastin reduces the number of swellings to control levels. (C) Spastin, but not GFP, overexpression restores the average neurite length to control levels. (D) Spastin, but not GFP, overexpression restores the average numbers of branching points per cell to control levels. (E) Spastin, but not GFP, overexpression significantly increases the average number of primary neurites per cell. There are significantly more primary neurites following M1 spastin overexpression compared with M87 spastin. (B–E) Evaluation of transduced cells shown in (A). NT, non-transduced; n, minimum of 20 cells per condition of 4–6 wells. Data shown as means ± SEM. Scale bars are 100 µm.

Similar articles

Cited by

References

    1. Blackstone C., O'Kane C.J., Reid E. Hereditary spastic paraplegias: membrane traffic and the motor pathway. Nat. Rev. Neurosci. 2011;12:31–42. - PMC - PubMed
    1. Kasher P.R., De Vos K.J., Wharton S.B., Manser C., Bennett E.J., Bingley M., Wood J.D., Milner R., McDermott C.J., Miller C.C., et al. Direct evidence for axonal transport defects in a novel mouse model of mutant spastin-induced hereditary spastic paraplegia (HSP) and human HSP patients. J. Neurochem. 2009;110:34–44. - PubMed
    1. McDermott C.J., Grierson A.J., Wood J.D., Bingley M., Wharton S.B., Bushby K.M.D., Shaw P.J. Hereditary spastic paraparesis: disrupted intracellular transport associated with spastin mutation. Ann. Neurol. 2003;54:748–759. - PubMed
    1. Wharton S.B., McDermott C.J., Grierson A.J., Wood J.D., Gelsthorpe C., Ince P.G., Shaw P.J. The cellular and molecular pathology of the motor system in hereditary spastic paraparesis due to mutation of the spastin gene. J. Neuropathol. Exp. Neurol. 2003;62:1166–1177. - PubMed
    1. Hazan J., Fonknechten N., Mavel D., Paternotte C., Samson D., Artiguenave F., Davoine C.S., Cruaud C., Durr A., Wincker P., et al. Spastin, a new AAA protein, is altered in the most frequent form of autosomal dominant spastic paraplegia. Nat. Genet. 1999;23:296–303. - PubMed

Publication types

MeSH terms