. 2014 May 1;31(9):803-18.
doi: 10.1089/neu.2013.3143. Epub 2014 Mar 31.

Astrocytic and vascular remodeling in the injured adult rat spinal cord after chondroitinase ABC treatment

Affiliations

Astrocytic and vascular remodeling in the injured adult rat spinal cord after chondroitinase ABC treatment

Ulla Milbreta et al. J Neurotrauma. .

Abstract

Upregulation of extracellular chondroitin sulfate proteoglycans (CSPG) is a primary cause for the failure of axons to regenerate after spinal cord injury (SCI), and the beneficial effect of their degradation by chondroitinase ABC (ChABC) is widely documented. Little is known, however, about the effect of ChABC treatment on astrogliosis and revascularization, two important factors influencing axon regrowth. This was investigated in the present study. Immediately after a spinal cord hemisection at thoracic level 8-9, we injected ChABC intrathecally at the sacral level, repeated three times until 10 days post-injury. Our results show an effective cleavage of CSPG glycosaminoglycan chains and stimulation of axonal remodeling within the injury site, accompanied by an extended period of astrocyte remodeling (up to 4 weeks). Interestingly, ChABC treatment favored an orientation of astrocytic processes directed toward the injury, in close association with axons at the lesion entry zone, suggesting a correlation between axon and astrocyte remodeling. Further, during the first weeks post-injury, ChABC treatment affected the morphology of laminin-positive blood vessel basement membranes and vessel-independent laminin deposits: hypertrophied blood vessels with detached or duplicated basement membrane were more numerous than in lesioned untreated animals. In contrast, at later time points, laminin expression increased and became more directly associated with newly formed blood vessels, the size of which tended to be closer to that found in intact tissue. Our data reinforce the idea that ChABC injection in combination with other synergistic treatments is a promising therapeutic strategy for SCI repair.


Figures

<b>FIG. 1.</b>
FIG. 1.
Efficient cleavage of chondroitin sulfate proteoglycans (CSPG) glycosaminoglycan side chains in a thoracic spinal cord hemisection lesion by intrathecal injections of chondroitinase ABC (ChABC) at the sacral level. CSPG (CS-56) immunofluorescence on spinal cord horizontal sections after 1 (A, B), and 2 weeks (w) (C,D) post-injury, in untreated (Lesion), and ChABC-treated (Les+ChABC) animals. In contrast to the persistent, strong CSPG labeling observed in untreated animals (A,C), after ChABC treatment (B,D) only traces of immunolabeling are left at the borders of the injury, particularly on blood vessels (arrowheads in D). Bar, 200 μm.
<b>FIG. 2.</b>
FIG. 2.
Glial scar evolution and axon remodeling 1 week post-injury, with or without chondroitinase ABC (ChABC) treatment; double immunofluorescence labeling for glial fibrillary acidic protein (GFAP) (A,B, E, F; green on merge image), and phosphorylated microtubule associated protein 1B (MAP1B-P) (C, D, E, F; red on merge image) on spinal cord sections of untreated (Lesion) and ChABC-treated (Les+ChABC) animals. E and F are higher magnification merge images of insets in A,C and B,D, respectively. GFAP labeling is less intense after the treatment (compare A and B), and astrocytic extensions are longer and more often oriented toward the injury site. Bar: A–D, 130 μm; E-F, 15 μm. Color image is available online at www.liebertpub.com/neu
<b>FIG. 3.</b>
FIG. 3.
Glial scar evolution and axon remodeling 2 weeks post-injury; double immunofluorescence labeling for glial fibrillary acidic protein (GFAP) (A,B, E, F; green on merge image) and phosphorylated microtubule associated protein 1B (MAP1B-P) (C, D, E-F; red on merge image) on spinal cord sections of untreated, and chondroitinase ABC (ChABC)-treated animals. E and F are higher magnification merge images of insets in A,C and B,D, respectively). Note that ChABC treatment renders the glial scar less dense (compare A with B), and considerably increases the total number of axons in the injury site, as well as the percentage of axons properly oriented in the rostrocaudal direction (compare C with D). Bar: A-F, 130 μm; G,H, 25 μm. Color image is available online at www.liebertpub.com/neu
<b>FIG. 4.</b>
FIG. 4.
Glial scar evolution and axon remodeling at 4 weeks post-injury; double immunofluorescence labeling for glial fibrillary acidic protein (GFAP) (A,B, E, F; green in merge image) and phosphorylated microtubule associated protein 1B (MAP1B-P) (C, D, E, F; red in merge image) on spinal cord sections of untreated (A,C,E), and chondroitinase ABC (ChABC)-treated animals (B,D,F). E and F are higher magnification merge images of insets in A,C, and B,D, respectively. Note that after treatment with ChABC, the GFAP-positive scar is not completely developed even at long term. Numerous axons are found in the injury site, oriented in the same direction as the astrocytic extensions (arrowhead, F), a phenomenon also observed in untreated animals, albeit much less frequently (arrowheads in E). Bars: A-D, 240 μm; E,F, 65 μm. Color image is available online at www.liebertpub.com/neu
<b>FIG. 5.</b>
FIG. 5.
Quantification of number and orientation of astrocytic processes and phosphorylated microtubule associated protein 1B (MAP1B-P) positive axons in untreated (red bars), and chondroitinase ABC (ChABC)-treated (black bars) animals. (A) Schematic representation of a horizontal section of the spinal cord. The dark grey area depicts the primary injury site delimited by the outer border of the glial scar, where densities of astrocytic processes (green) and axons (red) were measured. (B) Quantification of the area of the injury site occupied by glial fibrillary acidic protein (GFAP)- (dotted bars), and MAP1B-P-positive fibers (hatched bars) between 1 and 4 weeks post-injury. (C) Example of a three-dimensional reconstruction based on confocal images of the injury site from a ChABC-treated animal at 2 weeks post-injury, showing codistribution of MAP1B-P positive fibers (red) with GFAP-positive (green) processes. The directionality of GFAP-positive and MAP1B-P-positive structures is measured against the horizontal axis defined arbitrarily as angle 0 degrees, and differences between the angles of orientation of GFAP- and MAP1B-P positive structures are represented in (D). Note that alignment of fibers with astrocytic processes is always better in ChABC treated animals, although the difference is minimal at 2 weeks post-injury. GM, grey matter; WM, white matter. *p<0.05; **p<0,01. Bar is 45 μm. Color image is available online at www.liebertpub.com/neu
<b>FIG. 6.</b>
FIG. 6.
Evolution of immunolabeling for laminin (LN; left column, red in merge panels), and rat endothelial cell antigen (RECA-1) (middle column, green in merge panels) on spinal cord sections from lesioned untreated (Lesion) and chondroitinase ABC (ChABC)-treated (Les+ChABC) animals, compared with intact (control) animals (A,B, merge image in C). (D–I) 2 weeks, (J–0) 4 weeks post-injury; (D–F, J–L) untreated, (G–I, M–O) ChABC-treated animals. Note that within the injury site, RECA-1–positive blood vessels are less frequent than laminin-immunoreactivity would have suggested. At 4 weeks after ChABC treatment, LN shows important colocalization with RECA-1. F,I,L,O are higher magnification merge images of insets within the same row. Bars: A–C,F,I,L,O, 30 μm; D,E,G,H,J,K,M,N, 200 μm. Color image is available online at www.liebertpub.com/neu
<b>FIG. 7.</b>
FIG. 7.
Analysis of laminin-positive vascular basement membranes (BM). Compared with spinal cord injury (SCI) without treatment (A), after chondroitinase ABC (ChABC) treatment, splitting of laminin-positive BM is frequently seen on medium-sized (B) and hypertrophhied (C, confocal image) blood vessels. (D–F): After SCI in untreated animals, laminin is not only found in vascular BM, but high amounts of laminin-positive extracellular matrix deposits are seen at the injury site that persist throughout the period analyzed, shown here for 1 (D), 2 (E), and 4 (F) weeks post-injury. After ChABC treatment, these deposits are decreased (G–I). (J) Quantification of mean diameters of laminin-positive tubular structures shows a significant shift toward larger diameters in ChABC-treated compared with untreated animals at 1 and 2 weeks post-injury, while this tendency is inversed at 10 weeks post-injury. Error bars indicate standrd error of the mean. (K) Quantification of the size distributions of laminin-positive tubular structures, classified into four groups: 5–8 μm (small size), 8–15 μm (medium size), 15–30 μm (big size), and 30–90 μm (huge size) diameter. During the first 2 weeks post-injury, tubular structures of very large diameter are more frequent in ChABC-treated (ABC) than in untreated specimens (L), but at 10 weeks, the number of small vessels is higher for ChABC-treated than for untreated animals. Bars: A,B: 80 μm; C: 15 μm, D–F:80 μm. Color image is available online at www.liebertpub.com/neu
<b>FIG. 8.</b>
FIG. 8.
(A–C) AHNAK (A5) double immunostaining with SMI-71 in intact control animals, showing that all mature SMI-71 positive blood vessels are labeled with AHNAK antibody. (D-I) Co-immunostaining of AHNAK with rat endothelial cell antigen (RECA)-1 positive vessels is also found within the lesion site of chondroitinase ABC (ChABC)-treated animals 4 weeks post-injury (D–F, overview over the lesion site; G–I, higher magnification of an individual vessel). (J) RECA-1 labeling of the injury site, in ChABC-treated animals, 4 weeks post-injury. (K) Higher magnification of inset, with triple labeling for RECA-1, AHNAK, and 4',6-diamidino-2-phenylindole (DAPI, blue, nuclei) showing that numerous RECA-1–positive individual endothelial cells in the injury are also expressing AHNAK. Bar: A–C: 25 μm; D–F: 150 μm; G–I: 16 μm; J: 65 μm; K: 11 μm. Color image is available online at www.liebertpub.com/neu
<b>FIG. 9.</b>
FIG. 9.
SMI-71 immunolabeling on spinal cord sections at 2 weeks (A,B), and 4 weeks (C,D) post-injury; (A,C) untreated, (B,D) chondroitinase ABC (ChABC)-treated animals. Two weeks after the lesion, almost no mature blood vessels are observed within the injury site, both in untreated and treated animals. At 4 weeks, some mature blood vessels reappear in the injury site in both untreated and treated animals. Bars: 95 μm.
<b>FIG. 10.</b>
FIG. 10.
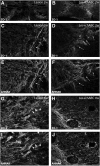
Tissular distribution of ZO-1 at the lesion site, shown at low (A,B) and at high magnification (C,D and G,H) of spinal cord sections taken at (A–D), 2 weeks; (G,H), 4 weeks post-injury. E,F, and I,J show the same sections as in C,D, and G,H, respectively, double immunostained for AHNAK. Left panels represent lesioned untreated (Lesion); right panels, chondroitinase ABC (ChABC)-treated (Les+ChABC) animals. At 2 weeks (A-D), ZO-1 labeling is present at the border of the lesion (arrows in C–F), colocalizing with AHNAK, but within the injury site, it is very weak in untreated animals and hardly detectable in ChABC-treated animals. In addition, under ChABC treatment, ZO-1 labeling at the border of the injury (arrows) appears more diffuse (D). At 4 weeks (G–J), ZO-1 exhibits a distribution pattern quite similar to that of AHNAK, with microcavities (stars) and blood vessels (arrowheads; G,I), but labeling is overall weaker and more diffuse in the lesion epicenter after ChABC treatment (H,J). C and D are higher magnifications of A and B, respectively. Bars: A,B: 160 μm; C–J: 95 μm.
<b>FIG. 11.</b>
FIG. 11.
Western blot analysis of AHNAK and laminin expression at the injury site in untreated (L), and chondroitinase ABC (ChABC)-treated (ABC) animals. (A) AHNAK expression increases after spinal cord injury (SCI) compared with intact control (C) animals at 1 week and remains elevated at 2 and 4 weeks post-injury. Laminin expression strongly increases after SCI and stays elevated until 4 weeks post-injury, similar to AHNAK. As shown in graph (B), after ChABC treatment, AHNAK expression is slightly decreased at 1 week post-injury, attains similar levels at 2 weeks, and is slightly increased at 4 weeks post-injury compared with untreated animals. (C) ChABC treatment has a slight but not significant effect on laminin expression levels during the first 2 weeks, which become significantly stronger (p<0.05) at 4 weeks post-injury. Actin is used as loading control and reference for calculating relative amounts of AHNAK and laminin immunoreactivity. Color image is available online at www.liebertpub.com/neu

Similar articles

Cited by

References

    1. Fitch M.T., and Silver J. (1997). Activated macrophages and the blood-brain barrier: inflammation after CNS injury leads to increases in putative inhibitory molecules. Exp. Neurol. 148, 587–603 - PubMed
    1. Rhodes K.E., and Fawcett J.W. (2004). Chondroitin sulphate proteoglycans: preventing plasticity or protecting the CNS? J. Anat. 204, 33–48 - PMC - PubMed
    1. Rhodes K.E., Raivich G., and Fawcett J.W. (2006). The injury response of oligodendrocyte precursor cells is induced by platelets, macrophages and inflammation-associated cytokines. Neuroscience 140, 87–100 - PubMed
    1. Silver J., and Miller J.H. (2004). Regeneration beyond the glial scar. Nat. Rev. Neurosci. 5, 146–156 - PubMed
    1. Sofroniew M. V. (2000). Astrocyte failure as a cause of CNS dysfunction. Mol. Psychiatry 5, 230–232 - PubMed

Publication types

Substances

LinkOut - more resources