. 2014 Jan 6;204(1):95-109.
doi: 10.1083/jcb.201306071. Epub 2013 Dec 30.

Cytoplasmic protein methylation is essential for neural crest migration

Affiliations

Cytoplasmic protein methylation is essential for neural crest migration

Katie L Vermillion et al. J Cell Biol. .

Abstract

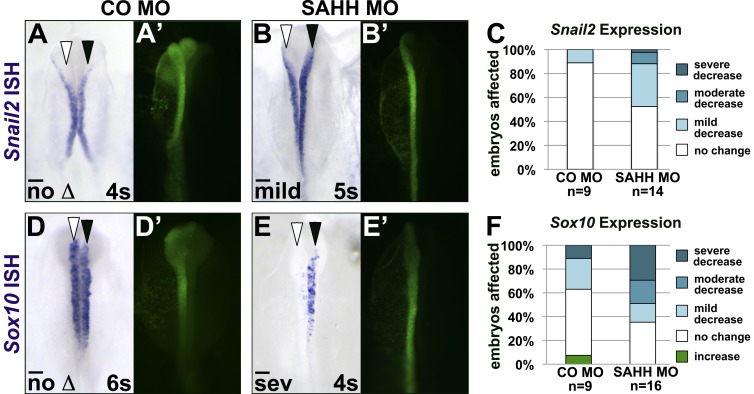
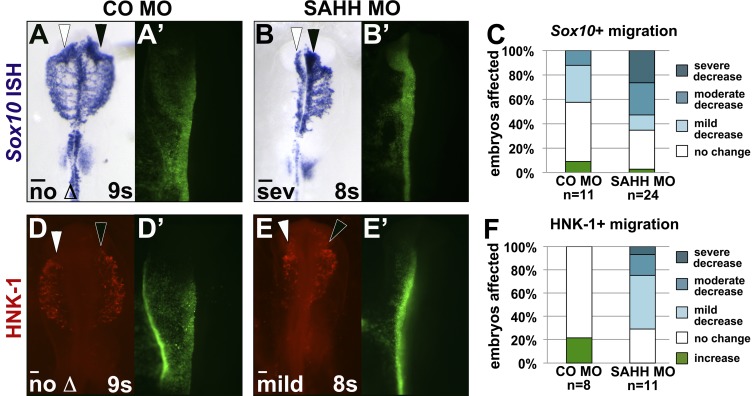
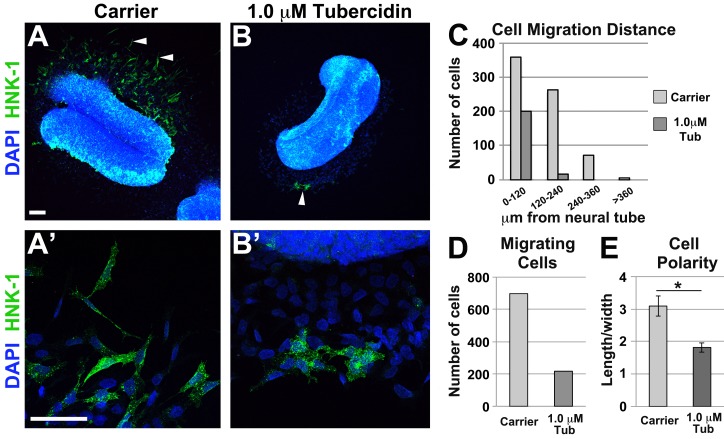
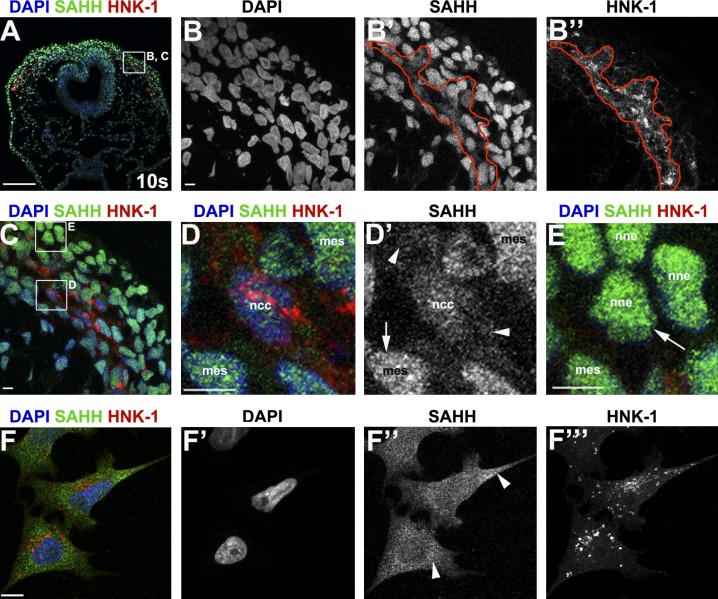
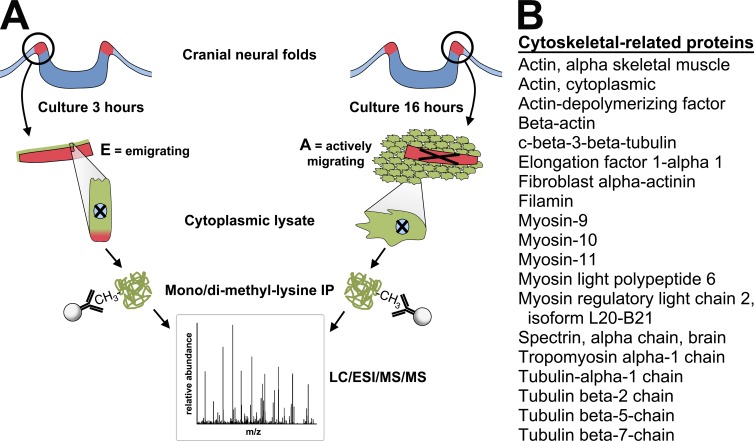
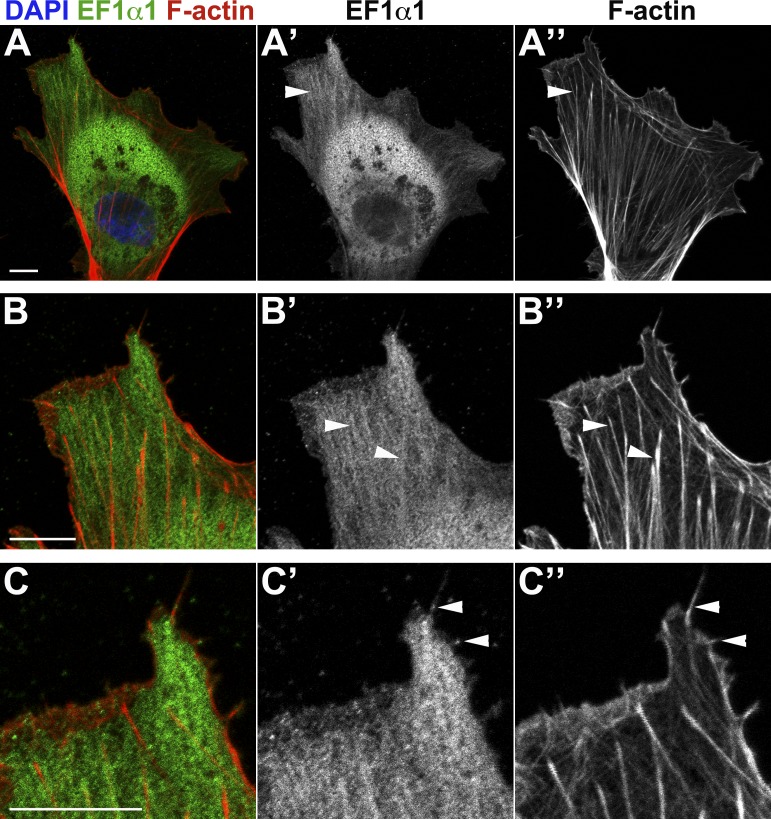
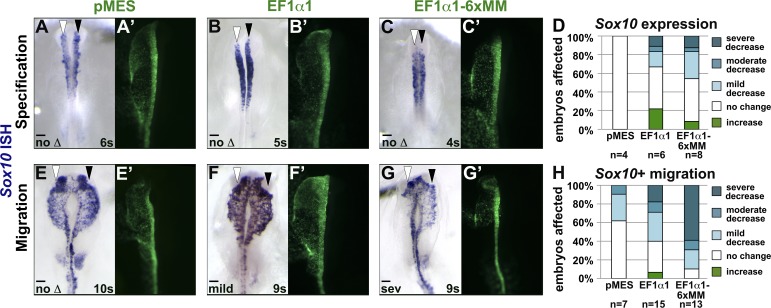
As they initiate migration in vertebrate embryos, neural crest cells are enriched for methylation cycle enzymes, including S-adenosylhomocysteine hydrolase (SAHH), the only known enzyme to hydrolyze the feedback inhibitor of trans-methylation reactions. The importance of methylation in neural crest migration is unknown. Here, we show that SAHH is required for emigration of polarized neural crest cells, indicating that methylation is essential for neural crest migration. Although nuclear histone methylation regulates neural crest gene expression, SAHH and lysine-methylated proteins are abundant in the cytoplasm of migratory neural crest cells. Proteomic profiling of cytoplasmic, lysine-methylated proteins from migratory neural crest cells identified 182 proteins, several of which are cytoskeleton related. A methylation-resistant form of one of these proteins, the actin-binding protein elongation factor 1 alpha 1 (EF1α1), blocks neural crest migration. Altogether, these data reveal a novel and essential role for post-translational nonhistone protein methylation during neural crest migration and define a previously unknown requirement for EF1α1 methylation in migration.


Figures

Figure 1.
Figure 1.
SAHH is required for neural crest cell specification. Embryos were unilaterally electroporated with standard control MO (CO MO; A’ and D’, green) or SAHH MO (B’ and E’, green) at late gastrula, reincubated to 4–6 somites (s), and processed by in situ hybridization (purple) to visualize expression of Snail2 (A and B) or Sox10 (D and E). White arrowhead, targeted side of embryo; black arrowhead, untargeted side of embryo. (A and B) Snail2 expression is mildly affected on the SAHH MO–targeted side (representative example shown in B; P = 0.07). (C) Stacked bar graph depicting the frequency and severity of Snail2 expression defects in embryos electroporated with CO MO or SAHH MO. (D and E) Sox10 expression is severely altered on the SAHH MO–targeted side (representative example shown in E; P = 3.44 × 10⁻³). (F) Stacked bar graph depicting the frequency and severity of Sox10 expression defects in embryos electroporated with CO MO or SAHH MO. (A, B, D, and E) dorsal views, fluorescent MO targeting in right panel. Bars, 100 µm.
Figure 2.
Figure 2.
SAHH is required for neural crest cell migration. Embryos were unilaterally electroporated with standard control MO (CO MO; A’ and D’, green) or SAHH MO (B’ and E’, green) at late gastrula and reincubated to 8–10 somites (s). Migratory neural crest cells were visualized by in situ hybridization for Sox10 (A and B, purple) or immunofluorescence for HNK-1 (D and E, red). White arrowhead, targeted side of embryo; black arrowhead, untargeted side of embryo. (A, B, D, and E) Neural crest migration distance is reduced in neural crest cells targeted with SAHH MO (Sox10 representative example shown in B, P = 2.05 × 10⁻⁴; HNK-1 representative example shown in E, P = 0.04). (C and F) Stacked bar graphs depicting the frequency and severity of Sox10 (C) or HNK-1 (F) visualized migration defects in embryos electroporated with CO MO or SAHH MO. (A, B, D, and E) dorsal views, fluorescent MO targeting in right panel. Bars, 100 µm.
Figure 3.
Figure 3.
Tubercidin inhibits neural crest migration and decreases neural crest cell polarity. (A–B) Tubercidin treatment disrupts neural crest migration. Trunk neural tubes were cultured on fibronectin-coated chamber slides in carrier (A and A’) or 1.0 µM tubercidin (B and B’) for 24 h. Cells were stained with anti–HNK-1 (neural crest, green) and DAPI (nucleus, blue). While numerous (A, white arrowheads) polarized and elongated (A’) neural crest cells migrate from carrier-treated explants, tubercidin treatment limits migration (B) and alters neural crest cell morphology (B’). Bars, 100 µm. (C) Bar graph depicting neural crest migration distance. HNK-1–positive neural crest cells from seven explants in each condition were measured and counted according to their distance away from the neural tube. In tubercidin, fewer neural crest cells emigrate, and these cells travel shorter distances. (D) Bar graph depicting the total number of HNK-1–positive neural crest cells migrating away from seven control or seven tubercidin-treated neural tubes. (E) Bar graph depicting length/width ratios, or polarity, of carrier- and tubercidin-treated neural crest cells. Tubercidin-treated neural crest cells were significantly less polarized (closer to 1, symmetrical) compared with carrier-treated neural crest cells (P = 3.3 × 10⁻⁴).
Figure 4.
Figure 4.
SAHH is cytoplasmically localized in migratory neural crest cells. 10 somite (s) chick embryo cross sections (A–E) and cultured cranial neural crest cells (F) immunostained for SAHH (B’, D’, and F’’, green), HNK-1 (neural crest; B’’ and F’’’, red), and DAPI (nuclei; B and F’, blue). (A) In embryos, SAHH immunoreactivity is widespread and nuclear. (B) A higher magnification view shows that SAHH immunoreactivity (B’) is more diffuse in HNK-1–positive (B’’) migratory neural crest cells (red outline). (C–E) At high magnification SAHH immunoreactivity is cytoplasmic (D’, white arrowheads) in neural crest cells (ncc), while SAHH is nuclear (D’ and E, white arrows) in head mesenchyme (mes) and nonneural ectoderm (nne). (F) In cultured cranial migratory neural crest cells (HNK-1–positive; F’’’), SAHH (F’’) is abundant in the cytoplasm (white arrowheads). (A–E) Transverse sections, dorsal up. (A–F) Maximum intensity projections of confocal z-stacks. Bars: (A) 100 µm; (all others) 5 µm.
Figure 5.
Figure 5.
Migratory neural crest cells have cytoplasmic methylated proteins. Chick 9 somite (s) midbrain sections (A and B) or cranial neural crest cell cultures (C) immunostained for mono-/di-methylated lysine (K-me1/2; A’’–C’’, green), HNK-1 (neural crest; A’’’–C’’’, red), and DAPI (nucleus; A’–C’, blue). (A) Lysine-methylated proteins (A’’, white arrowheads) are enriched in migratory neural crest cells (A’’’, black arrowheads). (B) A higher magnification view shows that lysine-methylated proteins (B’’) are present in the nucleus (black arrow) and cytoplasm (white arrow) of all cell types, but enriched (white arrowhead) in the cytoplasm of HNK-1–positive migratory neural crest cells (B’’’). (C) Individual cultured migratory neural crest cells (C’’’) have lysine-methylated proteins in the nucleus (C’’, black arrow) and peripherally localized in the cytoplasm (C’’, white arrowheads). (A–B) Transverse sections, dorsal up. (A–C) Maximum intensity projections of confocal z-stacks. Bars: (A) 10 µm; (B and C) 100 µm.
Figure 6.
Figure 6.
Proteomic profiling of lysine-methylated proteins identifies several cytoskeletal-related proteins. (A) Cytoplasmic methylated proteins were identified at two different time points during neural crest migration. Cranial neural folds were cultured for 3 h to obtain emigrating (E) neural crest cells, or 16–36 h with removal of the remaining neural fold to collect actively migrating (A) neural crest cells. Cytoplasmic fractions were prepared and immunoprecipitated using the antibody against mono- and di-methylated lysines. Immunoprecipitated proteins were separated by SDS-PAGE and were silver or Coomassie stained. Tryptic peptides were identified by liquid chromatography coupled to tandem mass spectrometry with electrospray ionization (LC/ESI/MS/MS). (B) Putatively methylated cytoplasmic proteins identified with high confidence that are involved in the cytoskeleton.
Figure 7.
Figure 7.
EF1α1 colocalizes with F-actin in the cytoplasm of migratory neural crest cells. Cranial neural crest cultures immunostained for elongation factor 1-α 1 (EF1α1; A’–C’, green), F-actin (phalloidin; A’’–C’’, red), and DAPI (nucleus; blue). (A) EF1α1 (A’, white arrowhead) is expressed in migratory neural crest cells and colocalizes with F-actin filaments (A’’, white arrowhead). (B–C) Higher magnification views show colocalization of EF1α1 with F-actin in lamella (B’ and B’’, white arrowheads) and filopodia (C’ and C’’, white arrowheads). Bars, 10 µm.
Figure 8.
Figure 8.
EF1α1 methylation is required for neural crest migration. Embryos were unilaterally electroporated with pMES vector DNA (pMES; A’ and E’, green), pMES-EF1α1-GFP fusion (EF1α1; B’ and F’, green), or pMES-EF1α1-6x-methyl mutant (EF1α1-6xMM; C’ and G’, green) at late gastrula. At 4–6 somites (A–C) or 8–10 somites (E–G), embryos were collected and Sox10 expression was assessed by in situ hybridization (purple). White arrowhead, targeted side of embryo; black arrowhead, untargeted side of embryo. (A–C) EF1α1-6xMM effects on specification resemble EF1α1. Sox10 expression is unchanged on the targeted side by pMES, EF1α1, or EF1α1-6xMM electroporation in the majority of embryos. (D) Stacked bar graph depicting the frequency and severity of Sox10 expression defects in embryos overexpressing pMES, EF1α1, or EF1α1-6xMM. (E–G) EF1α1-6xMM blocks neural crest migration. pMES electroporation does not affect neural crest migration distance on the targeted side (E), while EF1α1 electroporation elicits a broad range of phenotypes, with most embryos being mildly affected (F). EF1α1-6xMM electroporation severely decreased neural crest cell migration distance on the targeted compared with the untargeted side of the embryo (G). (H) Stacked bar graph depicting the frequency and severity of migration defects in embryos electroporated with pMES, EF1α1, or EF1α1-6xMM, showing that overexpression of EF1α1-6xMM significantly decreases neural crest migration compared with pMES or EF1α1 (P = 4.66 × 10⁻⁷; P = 6.81 × 10⁻⁴, respectively). (A–C and E–G) Dorsal views of in situ hybridization on left, fluorescent MO targeting on right. Bars, 100 µm.

Similar articles

Cited by

References

    1. Adams M.S., Gammill L.S., Bronner-Fraser M. 2008. Discovery of transcription factors and other candidate regulators of neural crest development. Dev. Dyn. 237:1021–1033 10.1002/dvdy.21513 - DOI - PMC - PubMed
    1. Ammer A.G., Weed S.A. 2008. Cortactin branches out: roles in regulating protrusive actin dynamics. Cell Motil. Cytoskeleton. 65:687–707 10.1002/cm.20296 - DOI - PMC - PubMed
    1. Bajpai R., Chen D.A., Rada-Iglesias A., Zhang J., Xiong Y., Helms J., Chang C.P., Zhao Y., Swigut T., Wysocka J. 2010. CHD7 cooperates with PBAF to control multipotent neural crest formation. Nature. 463:958–962 10.1038/nature08733 - DOI - PMC - PubMed
    1. Barth T.K., Imhof A. 2010. Fast signals and slow marks: the dynamics of histone modifications. Trends Biochem. Sci. 35:618–626 10.1016/j.tibs.2010.05.006 - DOI - PubMed
    1. Basch M.L., Bronner-Fraser M., García-Castro M.I. 2006. Specification of the neural crest occurs during gastrulation and requires Pax7. Nature. 441:218–222 10.1038/nature04684 - DOI - PubMed

Publication types

Substances