. 2014 Mar;196(3):767-80.
doi: 10.1534/genetics.113.159707. Epub 2013 Dec 27.

Genetic control of specificity to steroid-triggered responses in Drosophila

Affiliations

Genetic control of specificity to steroid-triggered responses in Drosophila

Robert J Ihry et al. Genetics. 2014 Mar.

Abstract

Steroid hormones trigger a wide variety of biological responses through stage- and tissue-specific activation of target gene expression. The mechanisms that provide specificity to systemically released pulses of steroids, however, remain poorly understood. We previously completed a forward genetic screen for mutations that disrupt the destruction of larval salivary glands during metamorphosis in Drosophila melanogaster, a process triggered by the steroid hormone 20-hydroxyecdysone (ecdysone). Here, we characterize 10 complementation groups mapped to genes from this screen. Most of these mutations disrupt the ecdysone-induced expression of death activators, thereby failing to initiate tissue destruction. However, other responses to ecdysone, even within salivary glands, occur normally in mutant animals. Many of these newly identified regulators of ecdysone signaling, including brwd3, med12, med24, pak, and psg2, represent novel components of the ecdysone-triggered transcriptional hierarchy. These genes function combinatorially to provide specificity to ecdysone pulses, amplifying the hormonal cue in a stage-, tissue-, and target gene-specific manner. Most of the ecdysone response genes identified in this screen encode homologs of mammalian nuclear receptor coregulators, demonstrating an unexpected degree of functional conservation in the mechanisms that regulate steroid signaling between insects and mammals.

Keywords: cell death; ecdysone; salivary glands; specificity; transcription.


Figures
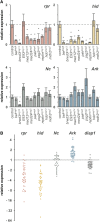
Figure 1
Figure 1
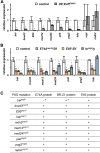
The ecdysone-induced expression of death activators is selectively disrupted in most PSG mutant salivary glands. (A) Eight of the 10 PSG mutations disrupt the ecdysone-induced expression of reaper (rpr) and/or hid in salivary glands dissected at 1.5 hr after head eversion (AHE). On the other hand, the ecdysone-induced expression of Ark and Nc is largely unaffected, indicating that the defects in hormone-induced transcription are target gene-specific. The y-axis plots relative expression of target genes measured by qPCR and compared to control. The x-axis shows control and mutant salivary glands. Each bar represents three independent biological samples normalized to rp49; asterisks indicate a significant reduction in expression compared to that in control glands (P-values <0.05). The allelic combinations used are shown in Table 1. (B) Molecular survey of 39 different PSG mutant salivary glands indicates that most PSG mutations disrupt initiation of the ecdysone-triggered death response. Expression of reaper, hid, Nc, Ark, and diap1 was measured in salivary glands dissected at +15 APF (equivalent to ∼ +3 AHE). The majority of PSG mutant glands display selective defects in the ecdysone-induced expression of rpr and hid, while Nc, Ark, and diap1 are expressed at near normal levels. Each dot represents a single sample of 30 salivary glands dissected from each PSG mutant analyzed. All samples were analyzed simultaneously and compared to three independent control samples dissected at +1.5 AHE (gray line at “1”). The y-axis shows relative expression (plotted on a log2 scale) normalized to both rpl18a and ubcd6.
Figure 2
Figure 2
PSG genes are required for a subset of stage- and tissue-specific ecdysone-induced responses during the onset of metamorphosis. (A) Schematic showing the three systemic pulses of ecdysone (blue boxes) at the onset of metamorphosis. Arrows mark the major developmental transitions triggered by each of these pulses of ecdysone: the mid-third instar transition (mid-L3), puparium formation, and pupation. L3, third instar larvae; PP, prepupae; P, pupae. (B) Global and salivary gland-specific responses to each of the three pulses of ecdysone (referred to as the mid-L3, late larval, and prepupal pulses) were scored in PSG mutant animals. The “+” and “−” indicate whether or not appropriate responses were observed. Ant. spir, anterior spiracles; MG PCD, midgut programmed cell death; SG PCD, salivary gland programmed cell death. Genotype of Sgs3 > EcRF645A is UAS-EcRF645A/+; Sgs3-GAL4/+. Allelic combinations used are shown in Table 1.
Figure 3
Figure 3
Most PSG genes show stage- and tissue-specific expression profiles. (A and B) Developmental expression profiles of target genes measured by qPCR in dissected salivary glands (A) or in whole animals (B). Previously characterized ecdysone target genes E74A and E75A show strong induction in response to the late larval (at −4 APF) and prepupal (at +10 APF) pulses of ecdysone, while E93 responds only to the prepupal pulse. Most PSG genes, however, show strong induction after the prepupal pulse of ecdysone in salivary glands yet remain relatively flat in whole animals. The y-axis plots relative expression measured by qPCR for each target gene compared to the stage with the lowest expression. The x-axis plots developmental stage relative to puparium formation in control salivary glands and whole animals. Each time point represents three independent biological samples normalized to rp49.
Figure 4
Figure 4
Many PSG genes encode components of the ecdysone-triggered transcriptional hierarchy. (A) Expression of a dominant negative version of the ecdysone receptor (EcRF645A) prior to the prepupal pulse of ecdysone blocks expression of most PSG genes in salivary glands, showing that the stage-specific induction in salivary glands is hormone-dependent. Control salivary glands (white bars) were dissected 1.5 hr after head eversion (AHE). OE:EcRF645A (UAS-GAL4/UAS-EcRF645A; hs-GAL4/+) glands (gray bars) were dissected at +1.5 AHE, after prepupae were heat-shocked 4 hr before head eversion (−4 AHE). The x-axis shows all 10 PSG genes and the y-axis plots relative expression compared to control and normalized to rp49. (B) The ecdysone primary response genes E74A, E93, and br-Z1 are required for the ecdysone-dependent induction of PSG genes in salivary glands. Shown is qPCR analysis of PSG gene expression in salivary glands dissected from control and mutant animals at +1.5 AHE. The x-axis shows all ecdysone-dependent PSG genes (except E93, which is a known ecdysone primary response gene). The colors of the bars indicate the genotype of the dissected salivary glands at +1.5 AHE: control (white), E74Aneo24/Df (pink), E931/Df (yellow), or brrbp5/y (blue). The y-axis plots relative expression of target genes compared to control and normalized to rp49. All qPCR data represent results from three independent biological samples with asterisks indicating significant change in expression compared to that in control glands (P-values <0.05). (C) Translation of ecdysone primary response proteins E74A, E93, and BR-Z1 in PSG mutant salivary glands. All mutant glands show robust expression of the three primary response genes (marked by “+”), except for absence of E74A protein in belpsg9 and E93 protein in E93psg11. Salivary glands were dissected at head eversion and analyzed by immunofluorescence with antibodies directed to E74A, E93, and BR-Z1 proteins. a, previously reported in Ihry et al. (2012).
Figure 5
Figure 5
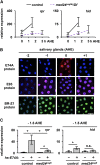
The PSG gene med24 amplifies hormone-dependent expression of effector genes reaper and hid. (A) Developmental expression profiles of rpr or hid in control (black solid line) and med24 mutant (purple dashed line) salivary glands. rpr and hid are induced, but at submaximal levels in mutant glands. The y-axis plots relative expression of reaper or hid as measured by qPCR. The expression ratios were calculated relative to those in −4 AHE control salivary glands, a stage prior to the prepupal pulse of ecdysone and the onset of reaper and hid expression. The x-axis plots developmental stage relative to hours after head eversion (AHE). (B) E74A protein expression coincides with the onset of rpr and hid transcription at head eversion, while E93 and Z1 proteins are robustly expressed earlier. Salivary glands were dissected and analyzed by immunofluorescence for expression of E74A (red), E93 (magenta), and BR-Z1 (green) proteins. Nuclei were costained with DAPI (blue). Bar, 50 μm. (C) Precocious expression of E74A protein is sufficient to induce expression of reaper and hid. Although ectopic E74A can induce reaper in med24 mutant glands, this induction is significantly lower than the response observed in control glands. Ectopic E74A cannot induce hid in med24 mutant glands. Control and mutant animals carrying one copy of the hs-E74A transgene (gray bars) were heat-shocked for 30 min at −4 AHE and salivary glands dissected 2 hr later (at −1.5 AHE). The same heat-shock treatment was given to control and mutant glands without the hs-E74A transgene (white bars). The x-axis shows the genotypes and the presence (+) or absence (−) of the hs-E74A transgene. The y-axis plots relative expression of reaper or hid as measured by qPCR. The expression ratios were calculated relative to those in −4 AHE control salivary glands. All qPCR data represent three independent salivary gland samples normalized to rp49; asterisks indicate significant differences in expression (P-values <0.05).
Figure 6
Figure 6
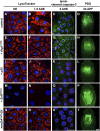
med24 is required for the ecdysone-triggered death response in larval salivary glands. (A–D) The death response in control salivary glands activates autophagy and caspases, resulting in tissue histolysis. LysoTracker staining (in red), used as a surrogate marker for autophagy, shows formation of large acidic structures only after the death response has been triggered (examples marked by white asterisks in B). In parallel, the death response triggers caspase activation (C), shown by staining with antibodies against cleaved caspase-3 (in green) and loss of staining of a target of caspases, nuclear lamin (in magenta). (D) The resulting tissue destruction is assayed by loss of the salivary gland-specific GFP expression (Sgs3-GAL4, UAS-GFP) at 24 hr after puparium formation (APF). (E–H) Salivary gland-specific expression of an inhibitor of autophagy, Atg1K38Q (UAS-Atg1K38Q/+; Sgs3-GAL4/+), blocks formation of the large LysoTracker-positive structures (E and F), but does not block caspase activation (G). Blocking only autophagy does not block tissue breakdown as shown by the absence of an intact PSG phenotype (H). (I–L) Conversely, expression of the caspase inhibitor p35 (UAS-p35/+; Sgs3-GAL4/+) does not block formation of large LysoTracker-positive structures (examples marked by white asterisks in J), but blocks activation of caspases (K). Blocking only caspase activation does not block tissue breakdown (L). (M–P) In contrast, blocking ecdysone signaling by expressing a dominant negative ecdysone receptor (UAS-EcRF645A/+; Sgs3-GAL4/+) blocks formation of any LysoTracker-positive structures (M and N) and blocks activation of caspases (O), resulting in a persistent salivary gland phenotype (P). (Q–T) In med24psg5 mutant glands, LysoTracker staining is similar to that in Atg1K38Q-expressing glands (Q and R); moreover, markers of caspase activity are similar to those of p35-expressing glands (S), suggesting that activation of autophagy and caspases does not occur. med24psg5 mutant animals have a PSG phenotype (T). Double bar in T, 200 μm for D, H, L, P, and T; bar in S, 50 μm for A–C, E–G, I–K, M–O, and Q–S. DAPI-costained nuclei are shown in blue. APF, hours after puparium formation; HE, head eversion; AHE, hours after head eversion; PSG, persistent salivary gland.

Similar articles

Cited by

References

    1. Andres A. J., Thummel C. S., 1994. Methods for quantitative analysis of transcription in larvae and prepupae. Methods Cell Biol. 44: 565–573. - PubMed
    1. Ashburner M., 1974. Sequential gene activation by ecdysone in polytene chromosomes of Drosophila melanogaster. II. The effects of inhibitors of protein synthesis. Dev. Biol. 39: 141–157. - PubMed
    1. Ashburner M., 1989. Drosophila: A Laboratory Manual. Cold Spring Harbor Laboratory Press, Cold Spring Harbor, NY.
    1. Ashburner M., Chihara C., Meltzer P., Richards G., 1974. Temporal control of puffing activity in polytene chromosomes. Cold Spring Harb. Symp. Quant. Biol. 38: 655–662. - PubMed
    1. Asim M., Hafeez B. B., Siddiqui I. A., Gerlach C., Patz M., et al. , 2011. Ligand-dependent corepressor acts as a novel androgen receptor corepressor, inhibits prostate cancer growth, and is functionally inactivated by the Src protein kinase. J. Biol. Chem. 286: 37108–37117. - PMC - PubMed

Publication types

LinkOut - more resources